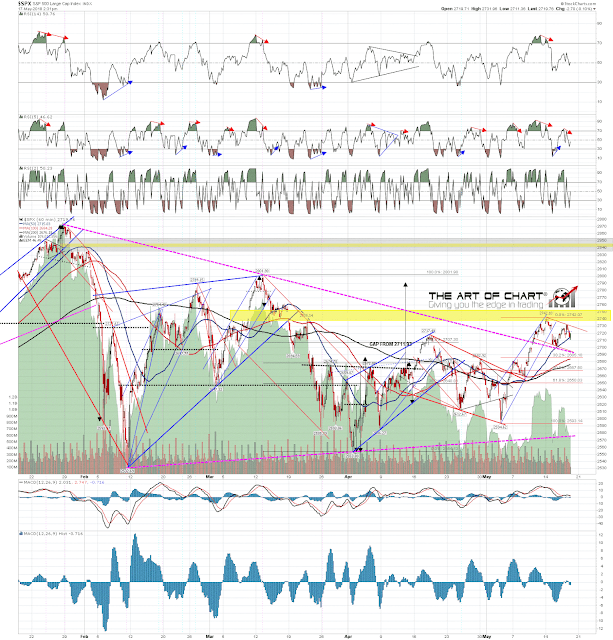
What is likely happening here is that SPX is doing an ABC retracement while forming a bull flag to go higher. Wave A was the first leg down and wave B was likely the rally into the lower high that we have seen so far. What we should see next is the C leg down below the wave A low, possibly extending as low as the daily middle band in the 2679 area, before the next leg up on SPX.
However last year that’s not the way this worked. The uptrend was so strong that every time the moment came for a second leg down, SPX broke up instead. That was the 2017 playbook and I’m not expecting to see that here, but it’s on my mind as a possibility.
Full Intraday Video from theartofchart.net – Update on ES, NQ and TF, and CL, NG, GC, HG, ZB, KC, SB, CC, ZW, DX, EURUSD, GBPUSD, AUDUSD, NZDUSD, USDJPY, USDCAD:
I’ve drawn in a possible flag channel, though obviously flags can also be wedges, megaphones or triangles. If this was to be a channel then SPX would likely find support at the retest of broken triangle resistance in the 2692 area. SPX 60min chart:
An hour after the close tonight Stan and I, and another friend of ours Matt, are presenting a webinar looking at strategies we have been trading on options based on the many futures that we analyse. This is part of a new service, Paragon Options, that we will be launching at the end of June looking for similar returns to the 200% or so per year achieved on our free Weekly Call portfolio so far, using complex strategies and tight risk management. If you are interesting in attending that webinar then you can register for that on our May Free Webinars page. If you’d like to watch the recording afterwards then that will be posted on the same page shortly tonight or tomorrow.
 17th May 2018