Last week I was looking at the high quality setup for a retracement but was looking for a modest move to the all time high retest on RUT before that got going. Today we are looking at SPX having gone considerably higher and at the time of writing RUT has still not delivered that full retest, though it came close at the high this morning. I did mention last week that the correlation between SPX and RUT tended to be variable.
Full Premarket Video from theartofchart.net – Update on ES, NQ, CL, NG, GC, SI, HG, ZB, KC, SB, CC, ZW, ZC, ZS, DX, EURUSD, USDJPY, USDCAD, AUDUSD:
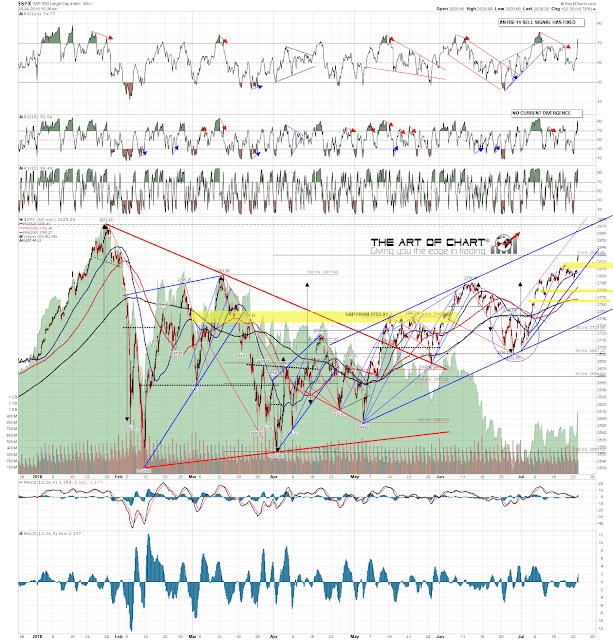
There are still high quality daily and hourly sell signals fixed on SPX, and that still favors retracement here short term. It’s important to remember though that on the bigger picture here SPX is in a thrust up from a triangle with a very clear target at a retest of the all time high at 2872.87, and the closer SPX gets to that target without retracing, the more likely it is that target will be hit before a significant retracement is seen. If we don’t see that retracement start today, SPX may well just head there directly. SPX 60min chart:
 24th Jul 2018