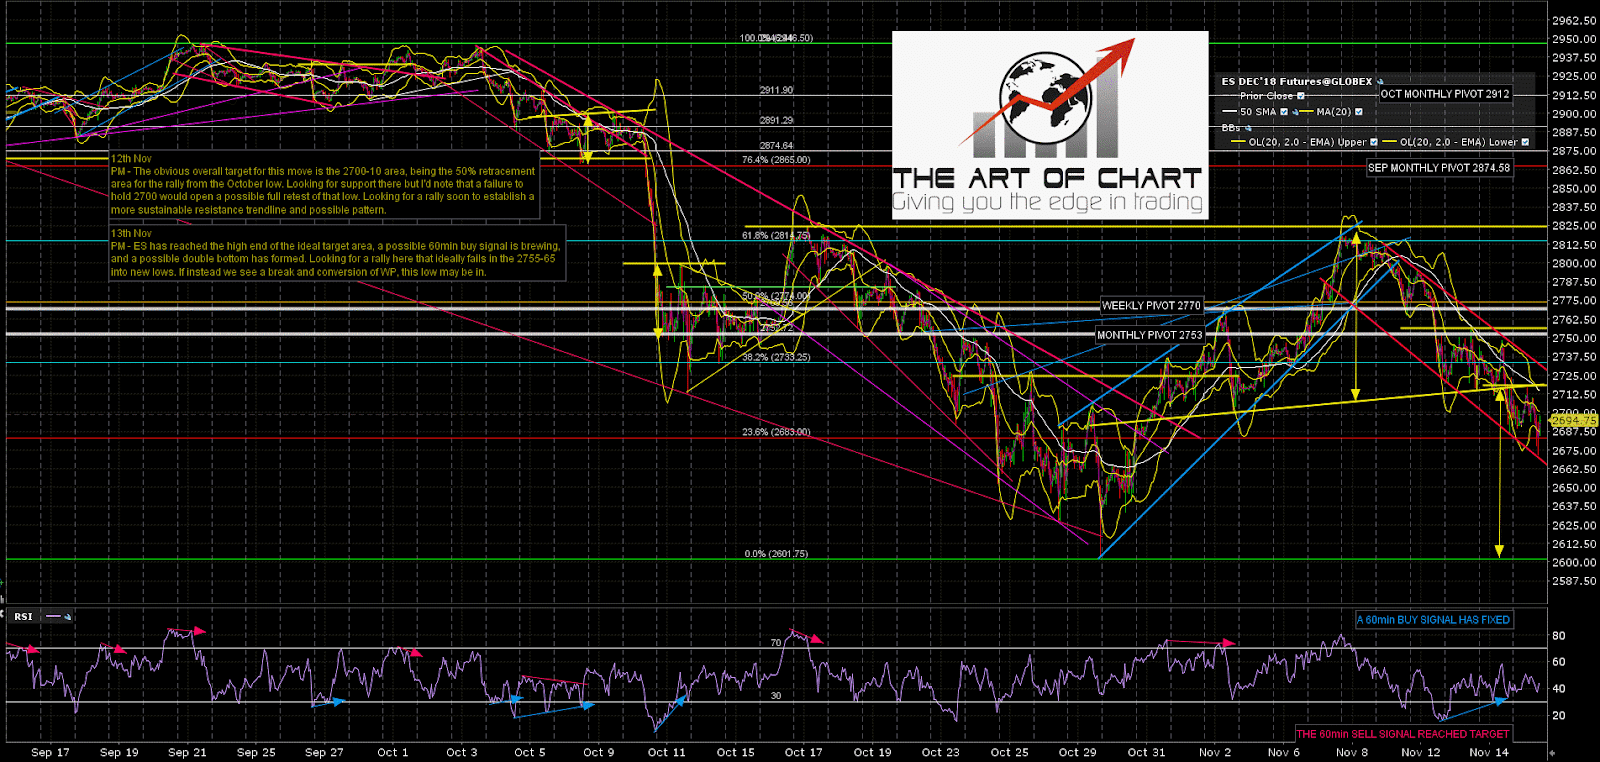
On my last post I was talking about the expected significant backtest on SPX, and we have now seen that retracement which has reached the 61.8% fib retrace area. At this point I’m expecting the main rally into Xmas to start in the next couple of days and that may well be starting here. However ……..
I did mention in my last post that this retracement might extend lower into a full retest of the October low, and there is a possible setup to deliver that in this inflection point. That bear case rests on a decent quality H&S that has formed and broken down on ES with a target at that retest of the late October low, with a perfect backtest of the broken neckline in the 2717/8 area overnight. The original IHS on SPX looking for 2910 has failed and this delivers a possible Janus Flag target at a retest of the prior low in the 2600 area. A sustained break below 2660 likely seals the deal for bears.
The bull case is that this is what I would call a Janus Flag, in that it looks like a topping pattern that breaks down and rejects hard into the preceding high (2815 area). That case is backed up by the decent quality falling megaphone that has formed from the high and would obviously need some confirmation from breaks of upside resistance. The important upside levels on ES area possible double bottom support at 2718, and a sustained break above looks for the 2760 area. Falling megaphone resistance is in the 2730 area and a break above likely seals the deal for bulls.
Important resistance on SPX is at declining resistance in the 2720 area, the 5dma and the daily middle band, both in the 2726/7 area, with the 50 hour MA currently well above keys areas at 2757.
We are expecting a rally into Xmas to start shortly and there is a LOT of positive RSI divergence here over multiple timeframes, including the open daily RSI 14 buy signals that fixed on the last move up. The obvious path on the overall setup is a break up into that rally directly from here, but I’ll be keeping an eye on the alternate bearish scenario which is a solid pattern setup as good as the bullish pattern setup but less likely due to other factors such as cycles. If the rally does start here then the obvious target area into Xmas for me would be in the 2850-2900 area. Whatever happens the next big target should either be a retest of the late October low or the November high. The odds of staying in the 2700 area are low.
Full Premarket Video from theartofchart.net – Update on ES, NQ, SPX, NDX, RUT, CL, NG, GC, SI, HG, ZB, KC, SB, CC, ZW, ZC, ZS, DX:
 15th Nov 2018