I was looking at the topping setup here before the open, among other things. Full premarket video below including a very nice reversal setup on GC.
Full Premarket Video from theartofchart.net – Updates on ES, NQ, RTY, DAX, ESTX50, SPX, NDX, RUT, CL, NG, GC, SI, HG, ZB, KC, SB, CC, ZW, ZC, ZS, DX, EURUSD, USDJPY, USDCAD & AUDUSD:
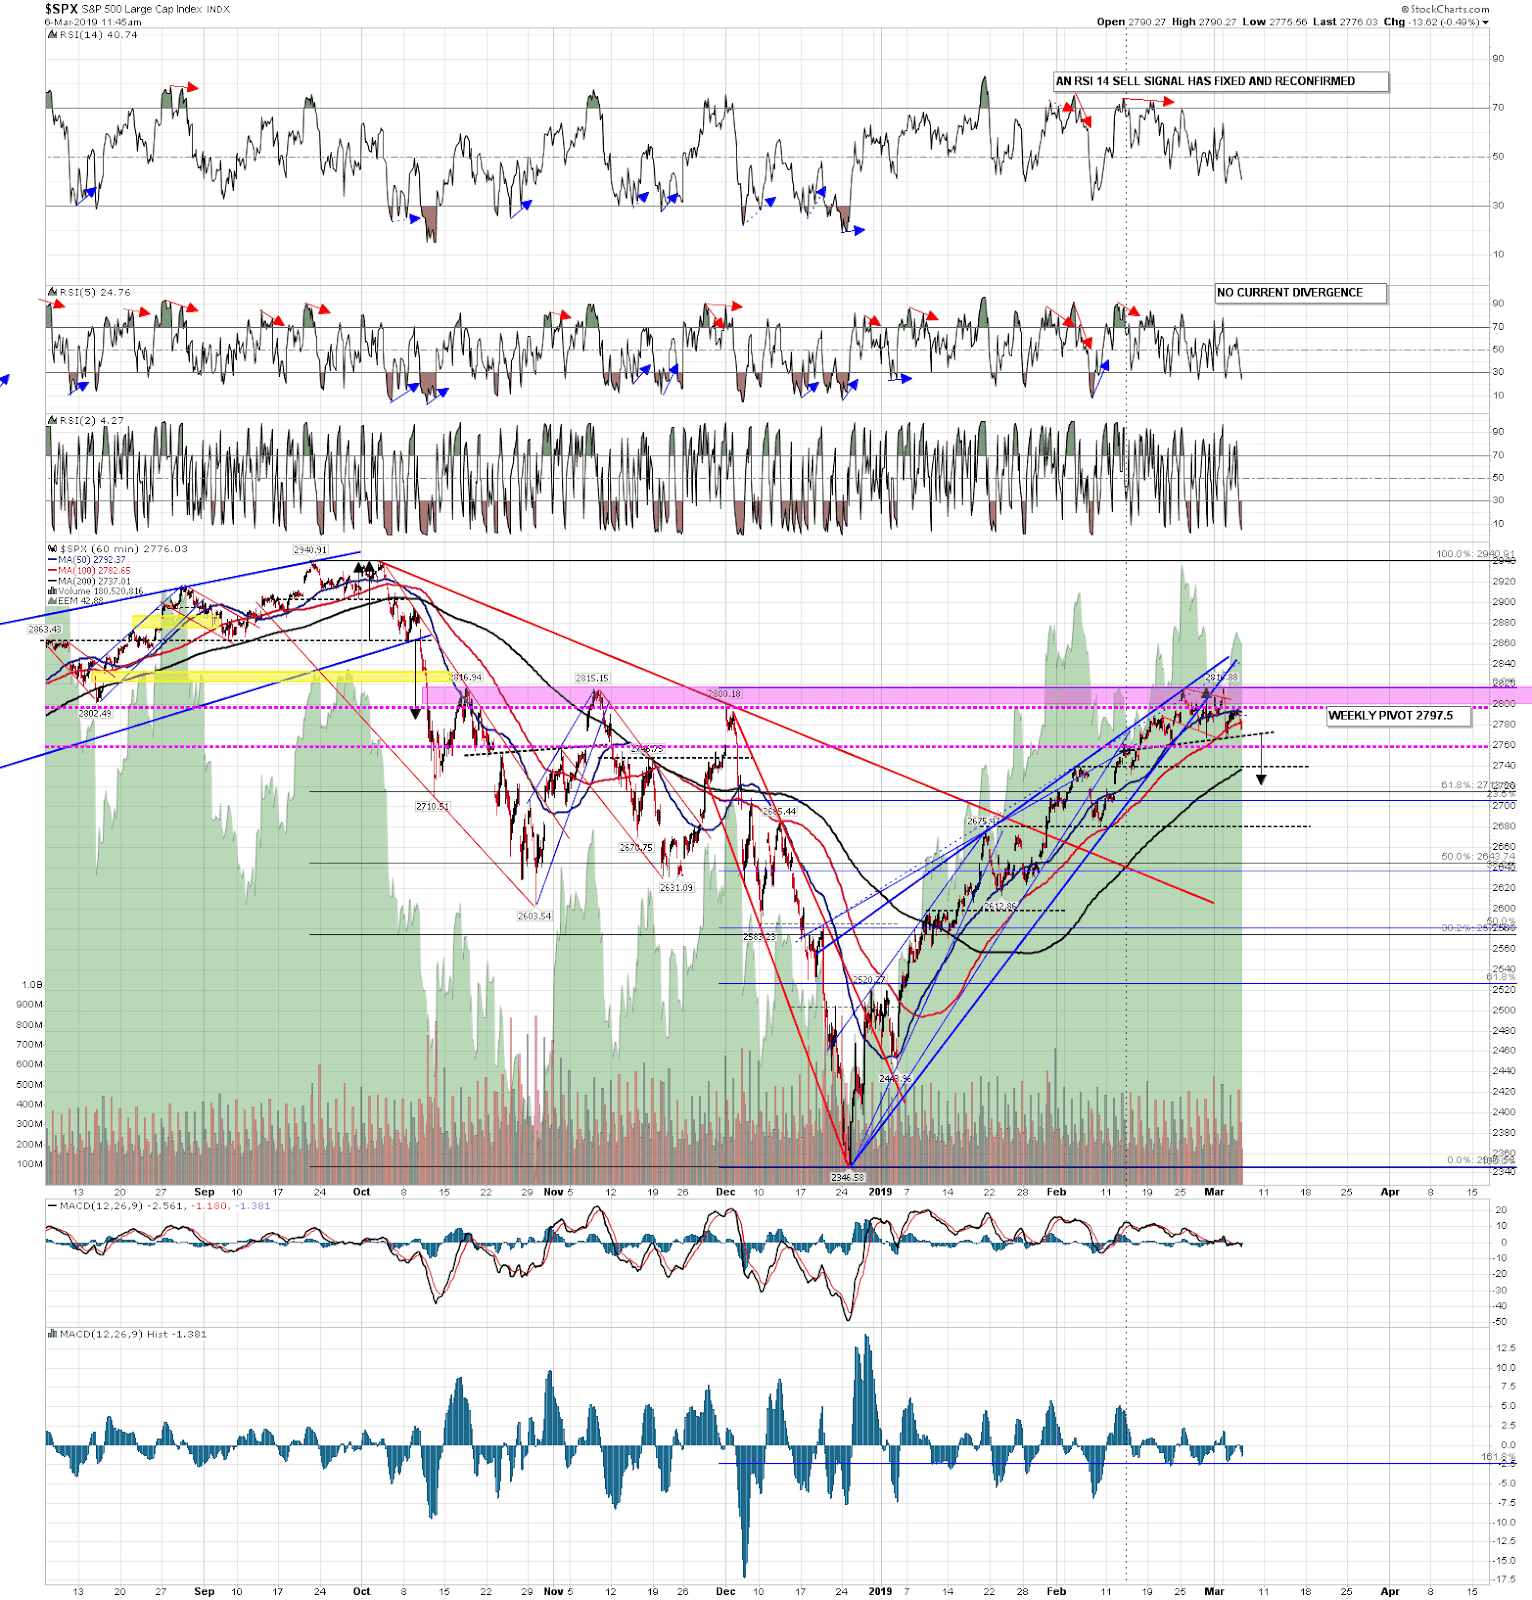
On SPX there is an H&S formed that has completed forming since I capped this chart, though it has not yet broken down. What I was talking about in the video was the possibility that the H&S would break down with a target in the 2720 area, reaching an inflection point just above the monthly pivot at 2760, and rejecting from it into a retest of the rally high. Alternatively SPX breaks though 2760, converts it to resistance, and then continues down to the H&S target in the 2720 area.
SPX 60min chart:
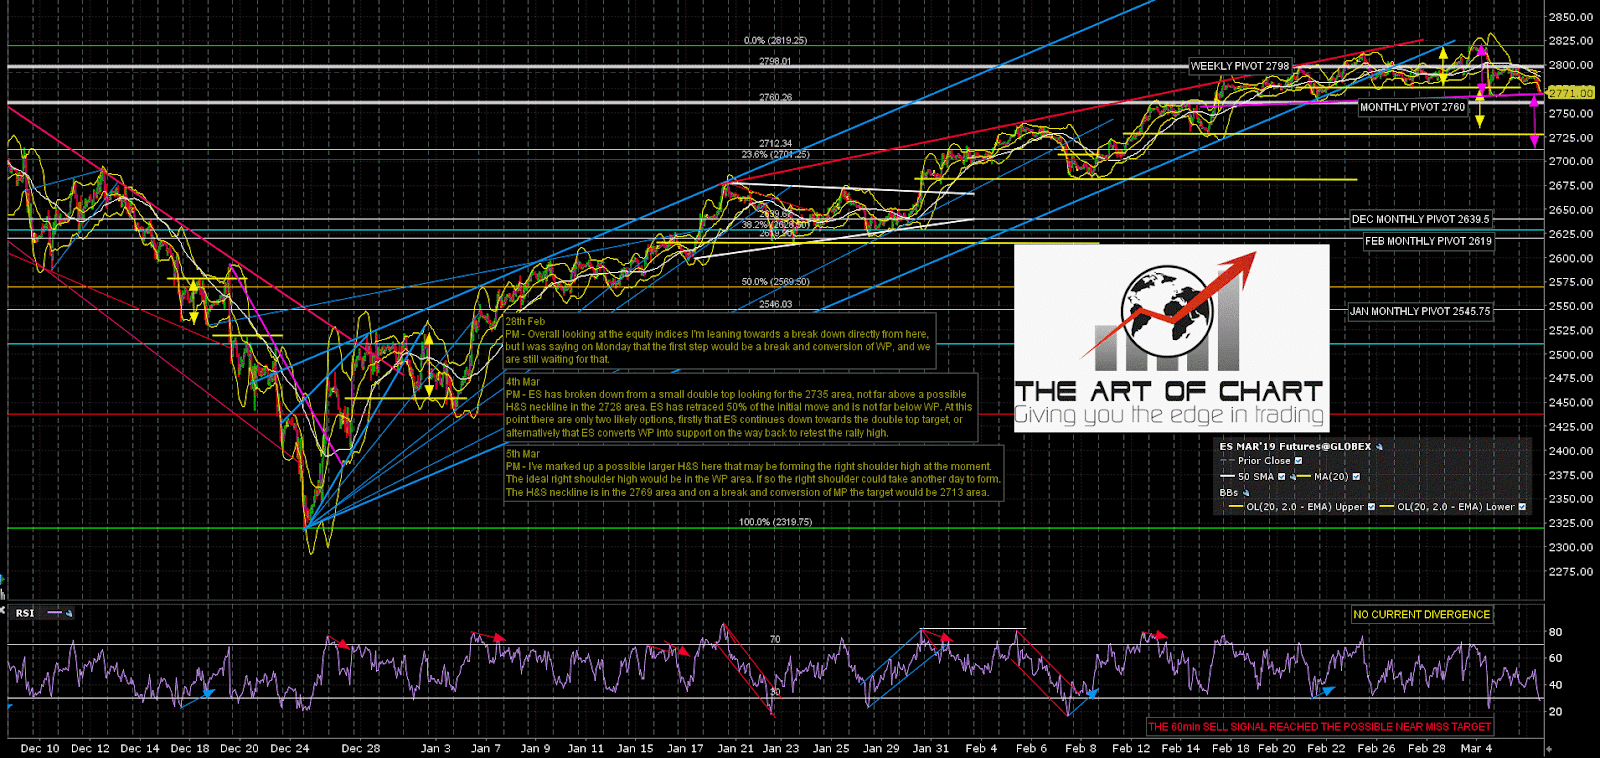
Similar setup on on ES except that the H&S has already broken down slightly.
ES Mar 60min chart:
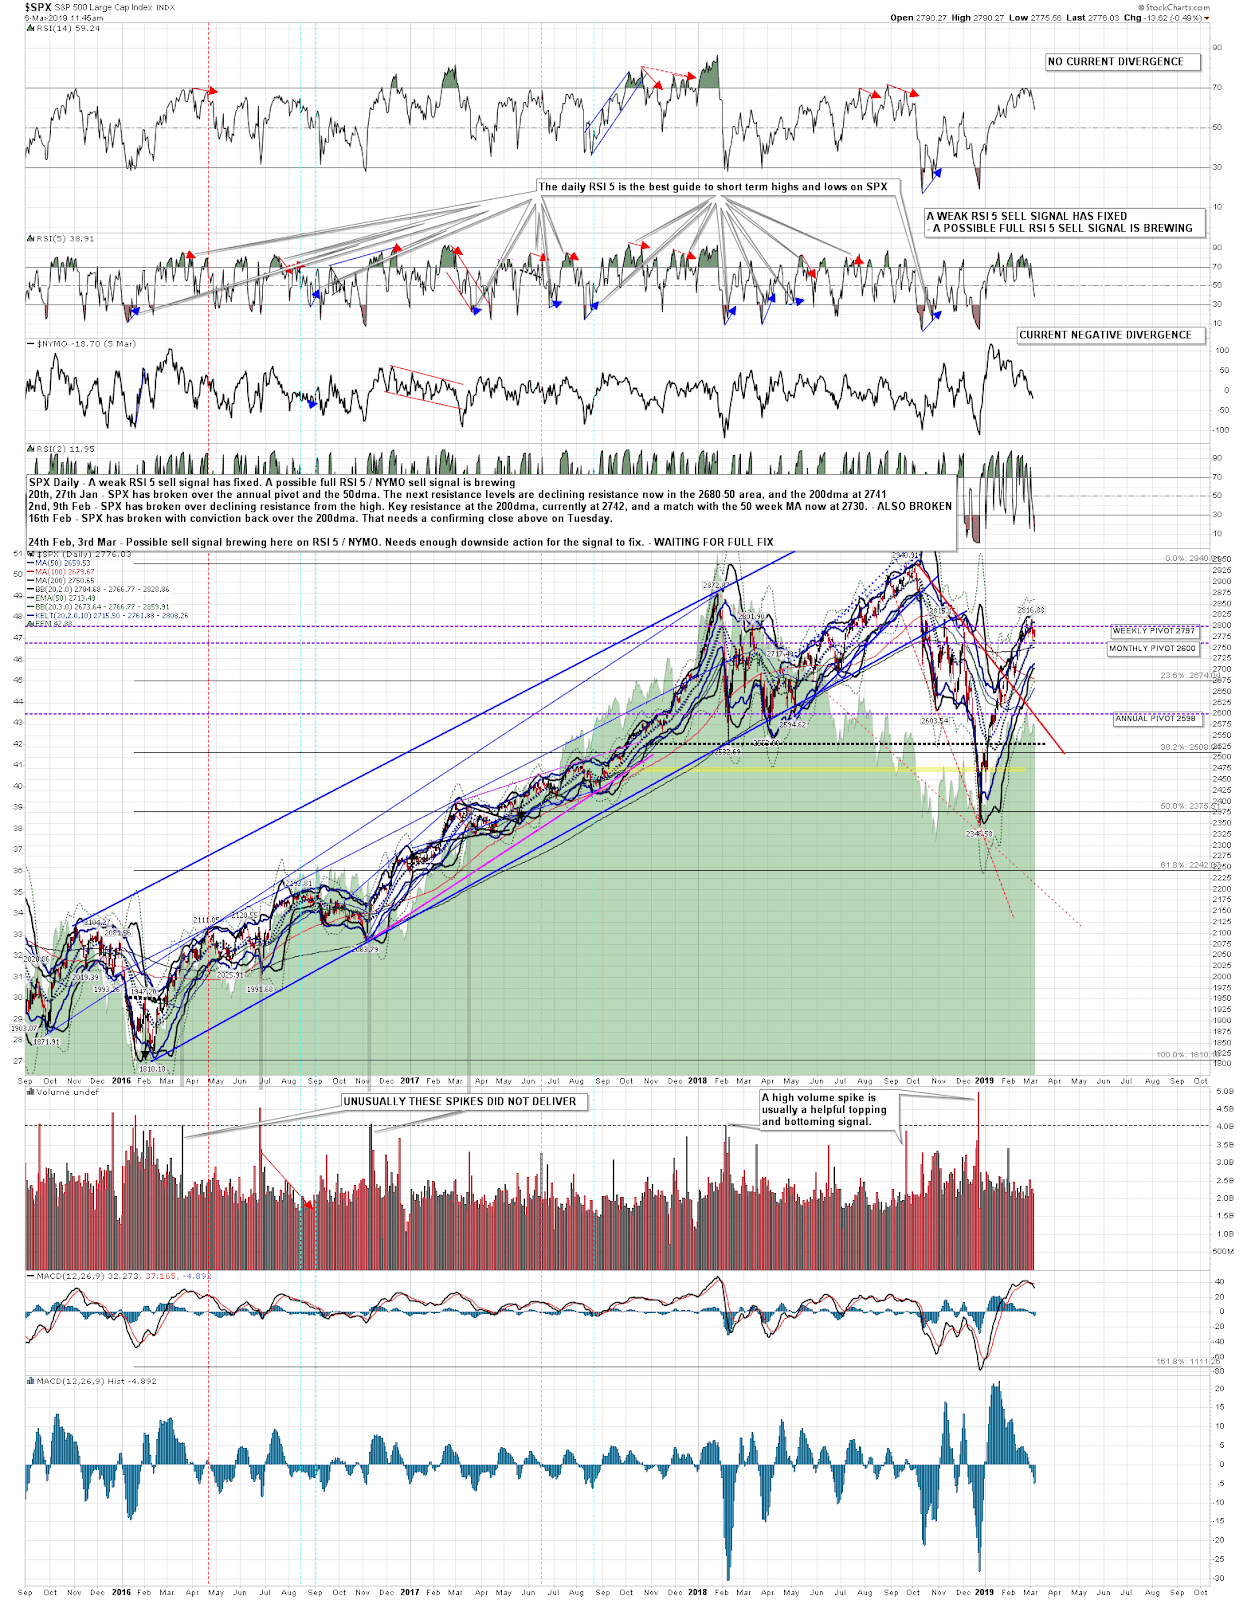
On the daily chart the full RSI 5 / NYMO sell signal should fix today until there is a strong rejection back up today. That would favor the 2720 target. I would also note that the 200dma is now at 2738.
SPX daily chart:
Stan and I did our free public Chart Chat on Sunday and if you missed that, the recording is posted on our March Free Webinars page.
 06th Mar 2019