On Thursday before I wrote my post SPX went a few handles below the daily 3sd lower band, and as I’d generally expect we saw a strong rally from there. On Friday, somewhat to my surprise SPX again went a few handles below the daily 3sd lower band, and we then saw an even stronger rally off that low. This morning, with the daily 3sd lower band currently at 2816, the current low of the day is a few handles lower and we’re probably going to see another rally, though it’s hard to say whether it will be as strong as the others.
Obviously the daily middle band is now turning down, and the lower it turns and the wider the bands become, the further down the daily 3sd lower band will extend, SPX could just keep riding this down.
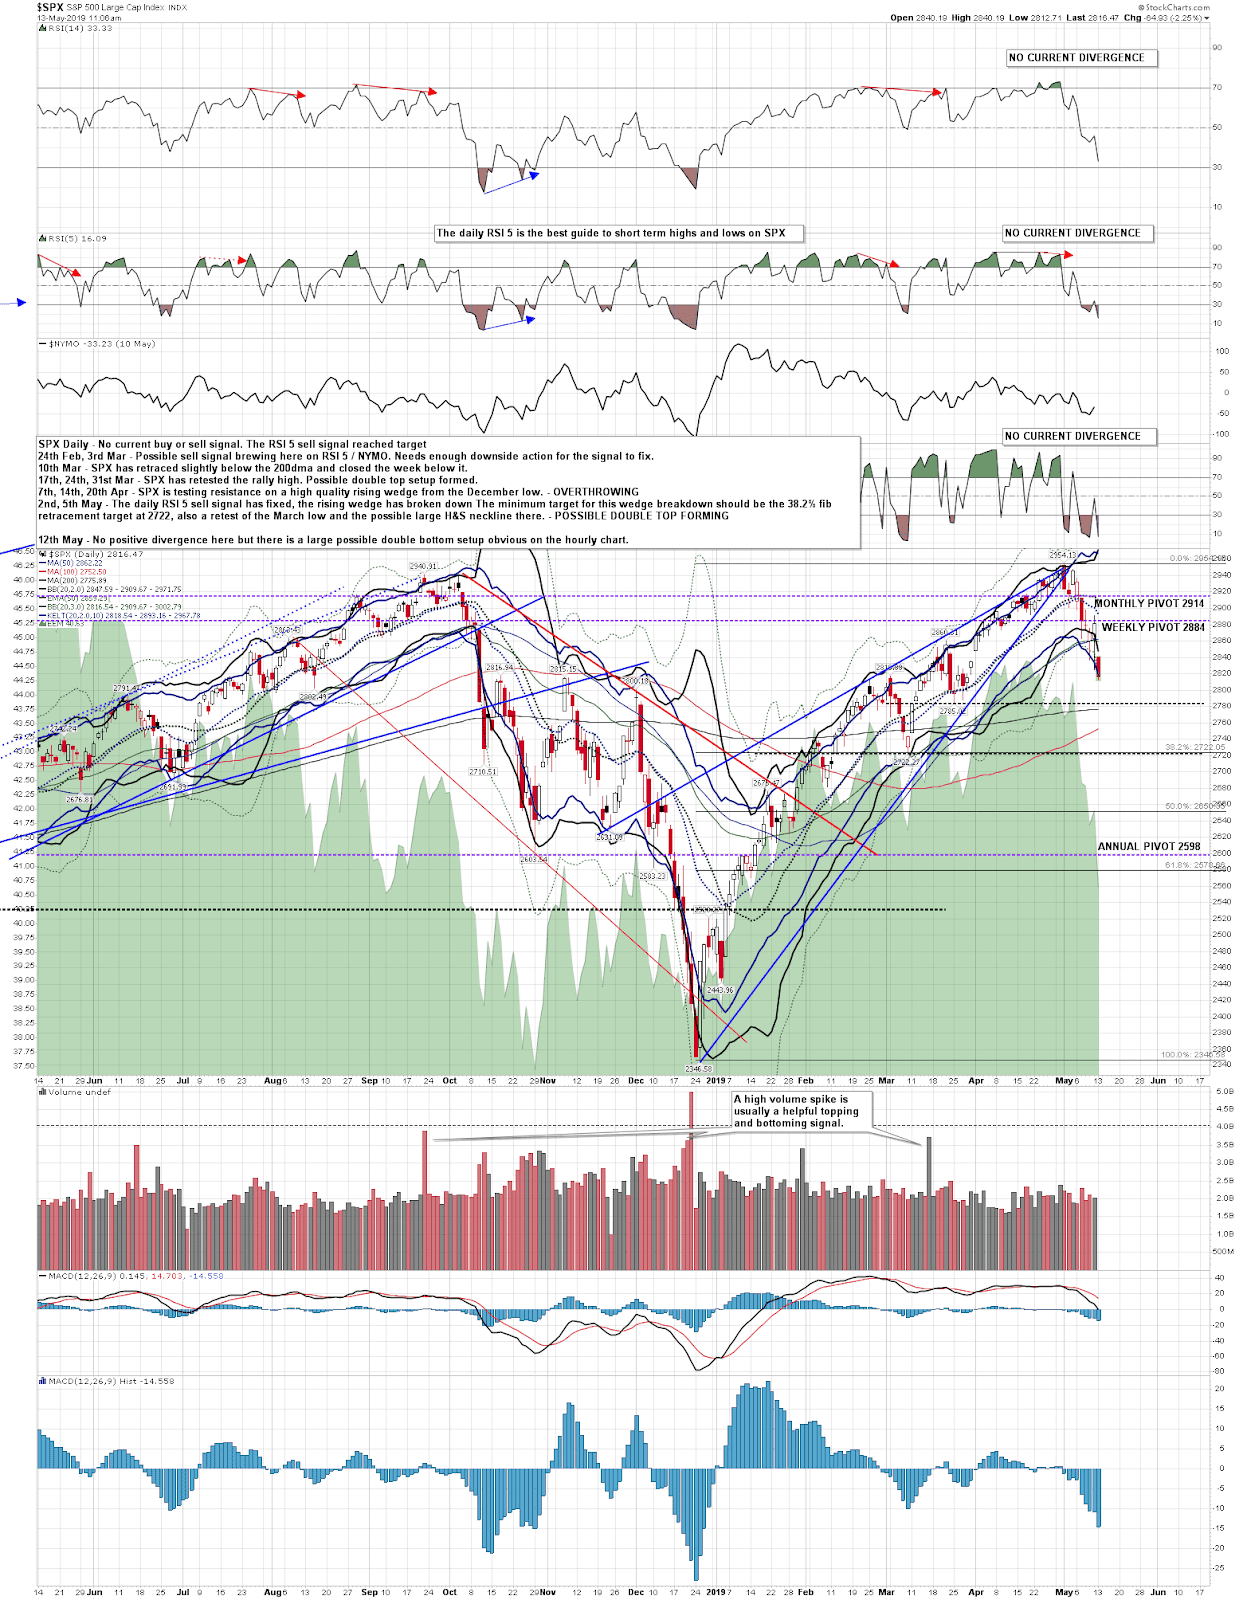
The current level is important though. I was asked a couple of weeks ago where I would expect the retracement to go, and I gave two targets. The first target is the current area, 2800-20, marked with the purple band on the SPX hourly chart below as an established strong support/resistance level. The second and preferred target is the 2722 area, at the full retracement of the rising wedge from the March low, and the 38.25 fib retracement of the rising wedge from the December low, also a possible larger H&S neckline. Stan ran the cycles last Thursday night with updated data and the next cycle window is a low window in two weeks. That is where I would like to see SPX at that low.
In the meantime I’m still looking for a possible wave B retracement, with the caveat that we may already have seen a very fast B wave rally on Friday. If that is not yet done I’d be looking for strong resistance at the daily middle band, now at 2909, and the monthly pivot at 2914. A break and conversion of those levels to support could trigger an ATH retest.
SPX daily chart:
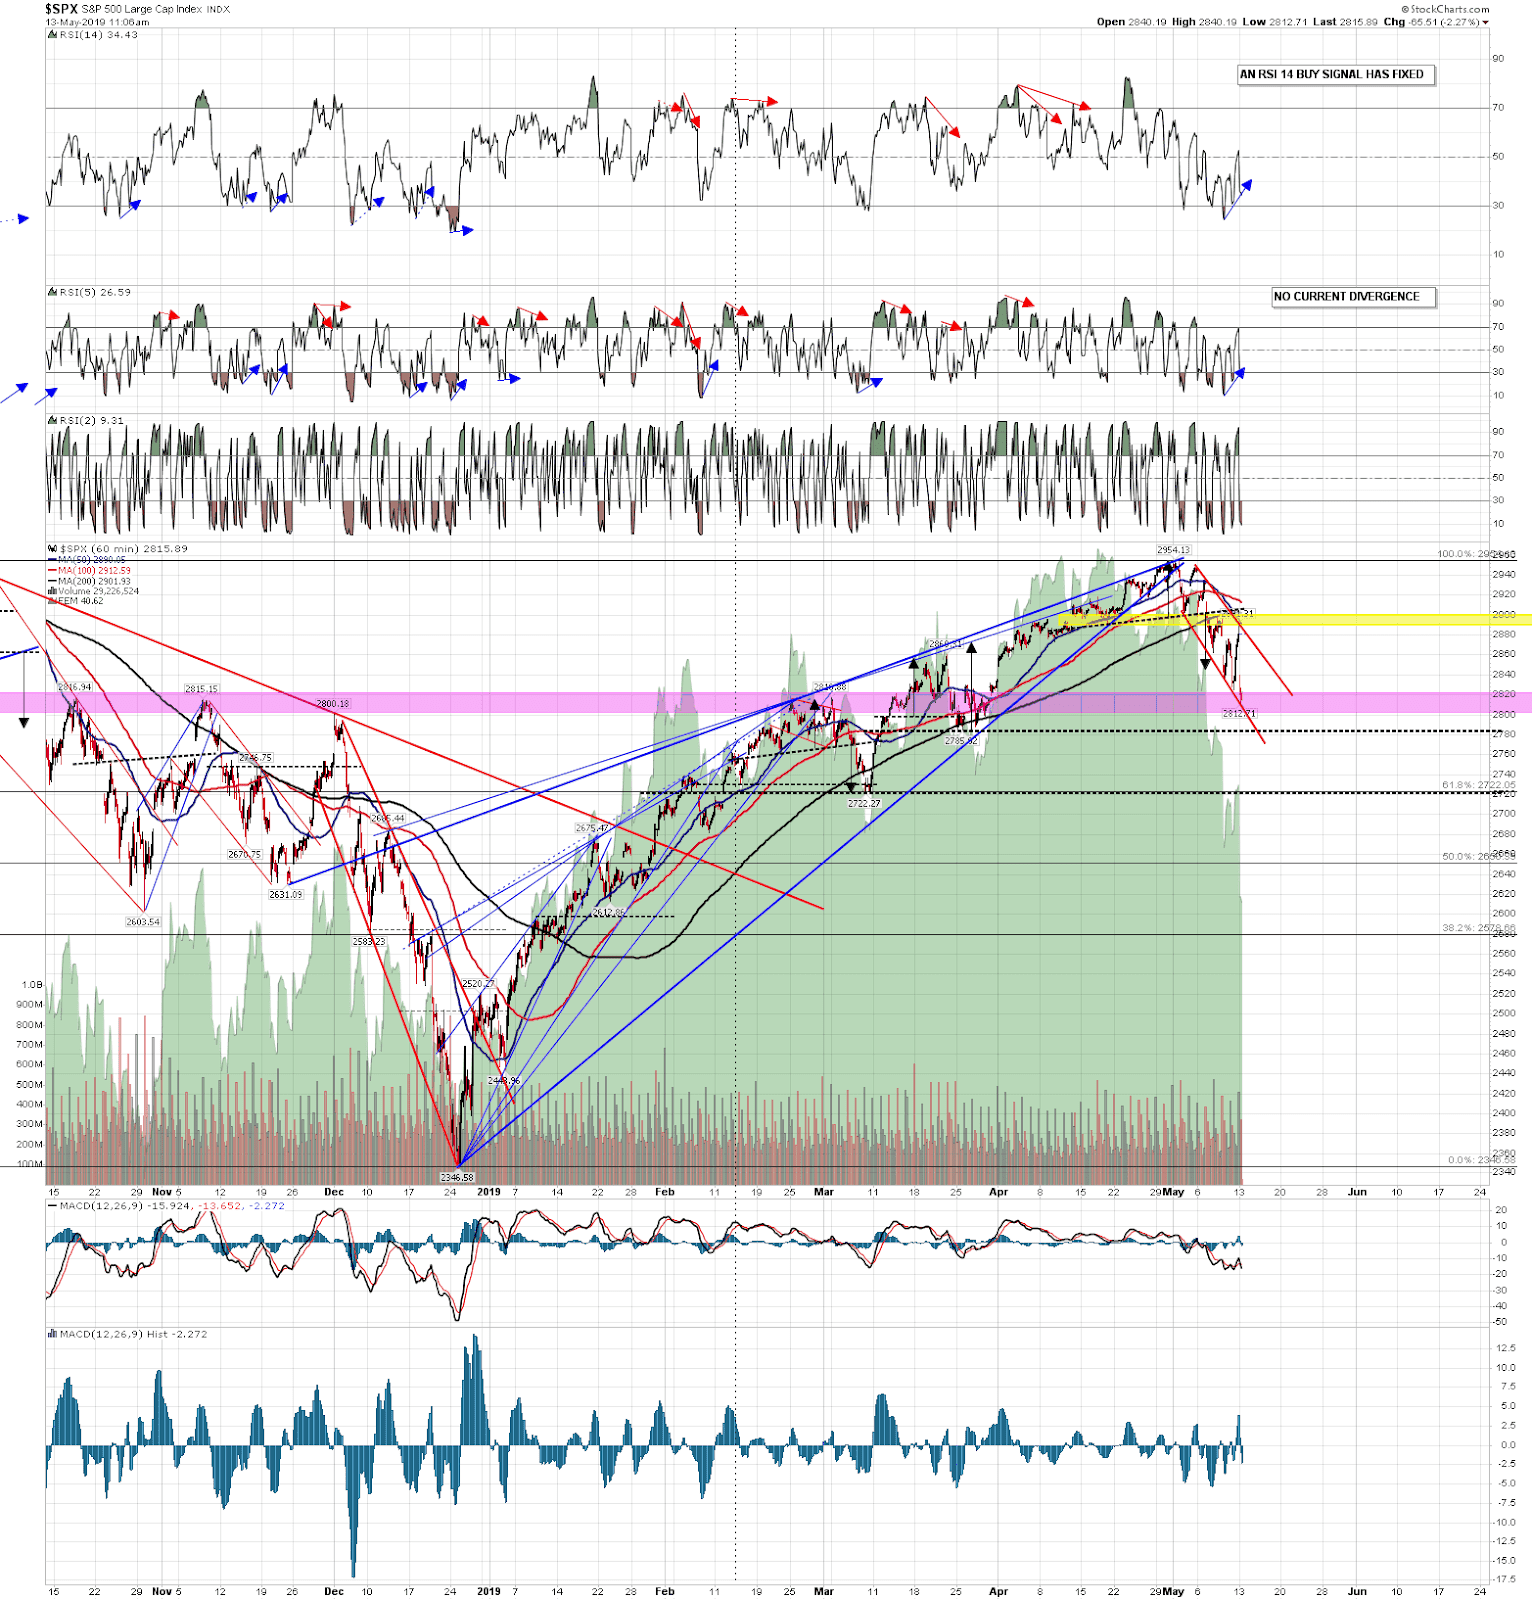
On the hourly chart SPX is testing a big support zone here, and this would be an obvious level to rally from. I’d note that hourly RSI 14 buy signals fixed on all of SPX, NDX, and RUT on Friday though of course a very strong trend can overwhelm these. SPX is testing a high quality falling megaphone support trendline that may hold.
SPX 60min chart:
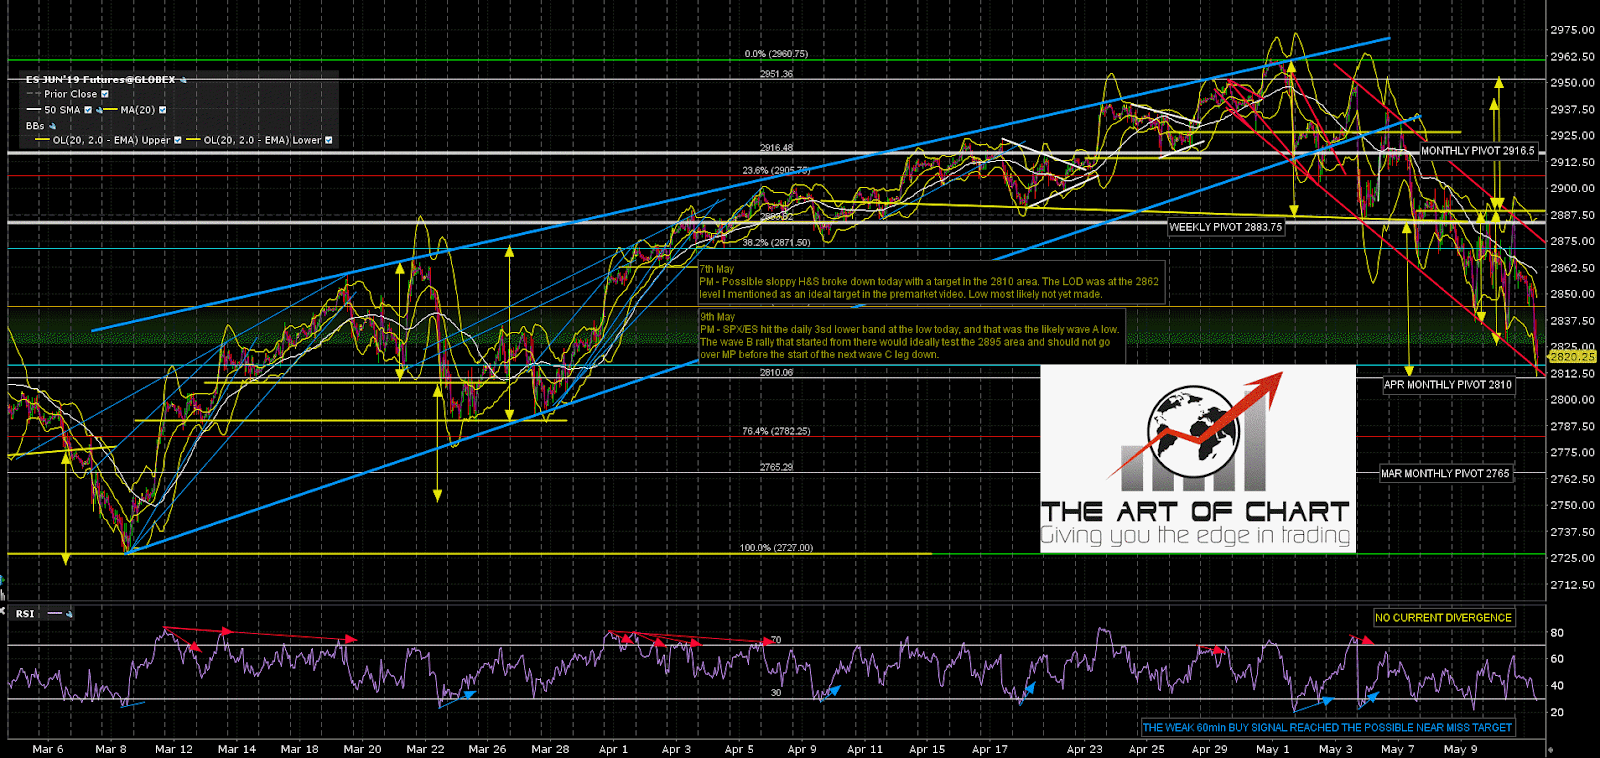
No current divergence on the ES 60min chart, though ES is testing trendline support here as well.
ES Jun 60min chart:
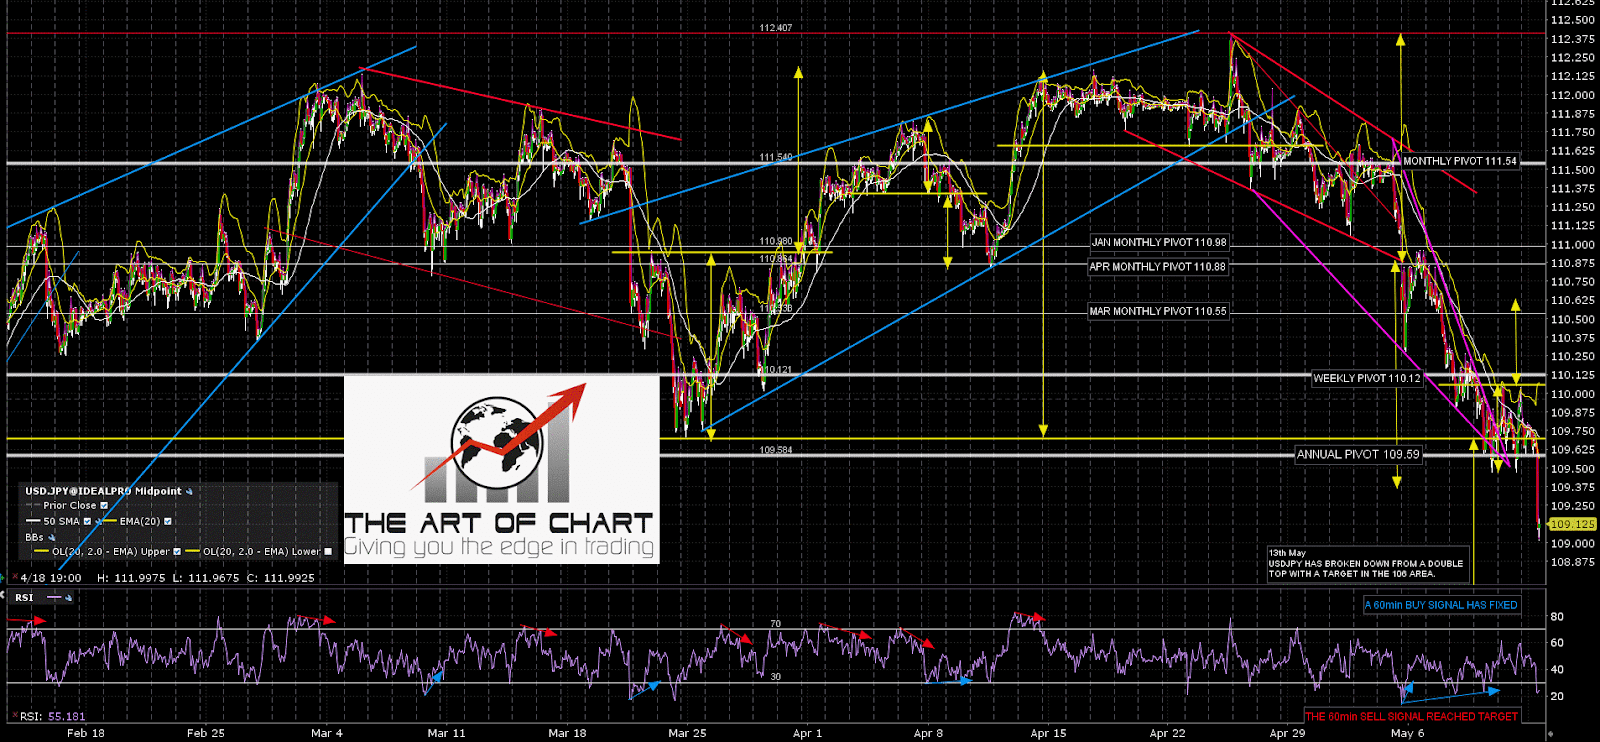
One thing I was looking at on Friday that was encouraging for a rally on equities here was the strong reversal setup on USDJPY formed on the initial break of major double top support and annual pivot test. A 60min buy signal fixed and a high quality double bottom setup formed. Obviously there is a very decent correlation between USDJPY and SPX. Overnight that long setup fell apart with a strong break below the annual pivot towards the double top target considerably lower at 106. Obviously that is not that encouraging for a strong rally, though it is encouraging for my main target in the 2722 area being reached. We will see.
USDJPY 60min chart:
Regardless of a possible stronger rally here, SPX is trading under the daily 3sd lower lower band as I write, that is strong support for today and on a daily lower band ride we would almost always see a test of the daily 2sd lower band at some point during the day. That is currently at 2846.
An hour after the close on Thursday Stan and I are doing our free monthly public webinar on big five and sectors, covering AAPL, AMZN, FB, GOOG, NFLX, TSLA, IBB, IYR, XLE, XLF, XLK and XRT. Given the current market action that should be pretty interesting, and if you’d like to attend you can register for that here, or on our May Free Webinars page.
 13th May 2019