Well the holidays are upon us, and many of those of us with lives, or even just social lives, have taken a couple of weeks off to do non-market stuff. Even the algos seem suspiciously quiet and may be taking a few days off too. I’m still here because …. well ……. it’s my job, and someone has to stick around to switch off the lights and lock the doors after the last buyer has departed for the holidays. In the meantime I’m doing an update for anyone still around to read it.
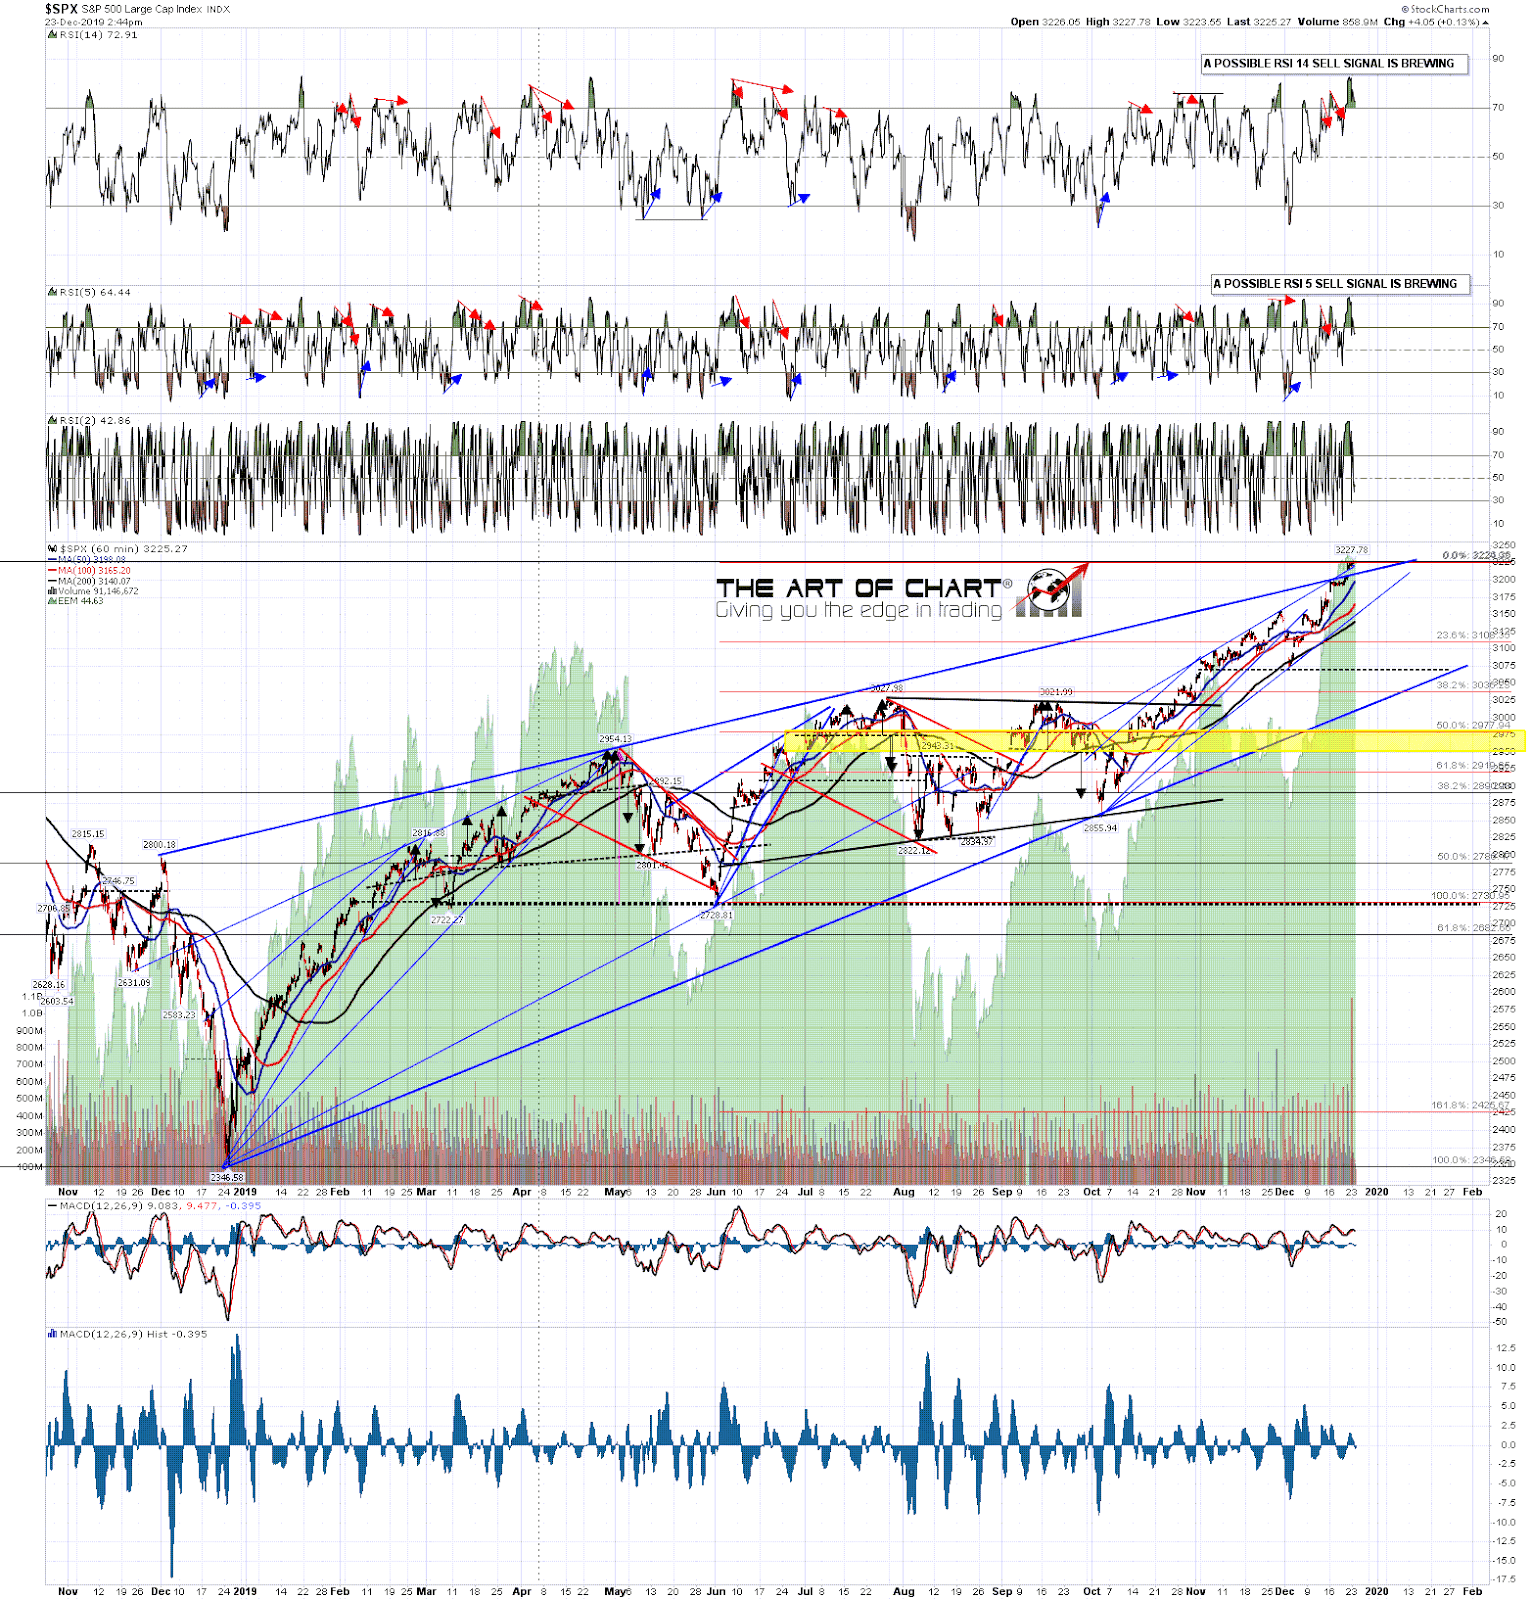
Since my post a week ago SPX went higher as expected, and then went higher still. Everything is still pretty much as expected however, except that the SPX 60min sell signals failed, and the negative divergence on the daily RSI 14 was lost. As I write there are new SPX hourly RSI 14 and RSI 5 sell signals brewing, but to set up new divergence on the daily chart is likely to require a retracement and high retest to set a new daily RSI 14 sell signal brewing.
The big news on Friday however was that there was a big volume spike into Friday’s high on the daily chart. These are rare and tend to signal that a significant short term high or low is being made or is close. Good to see when such a high is expected, and you can see that and the last few examples on the chart below.
Whether SPX sees much downside before some market participants return after the holiday is another question, but they should be trickling back by the end of this week, and the one unambiguously bearish day of December is the last trading day, Tuesday 31st December, and if we are to see a retracement in the first quarter of 2020 as expected, then I would usually expect to see a bearish first trading week of January to confirm that. We will see.
SPX daily chart:

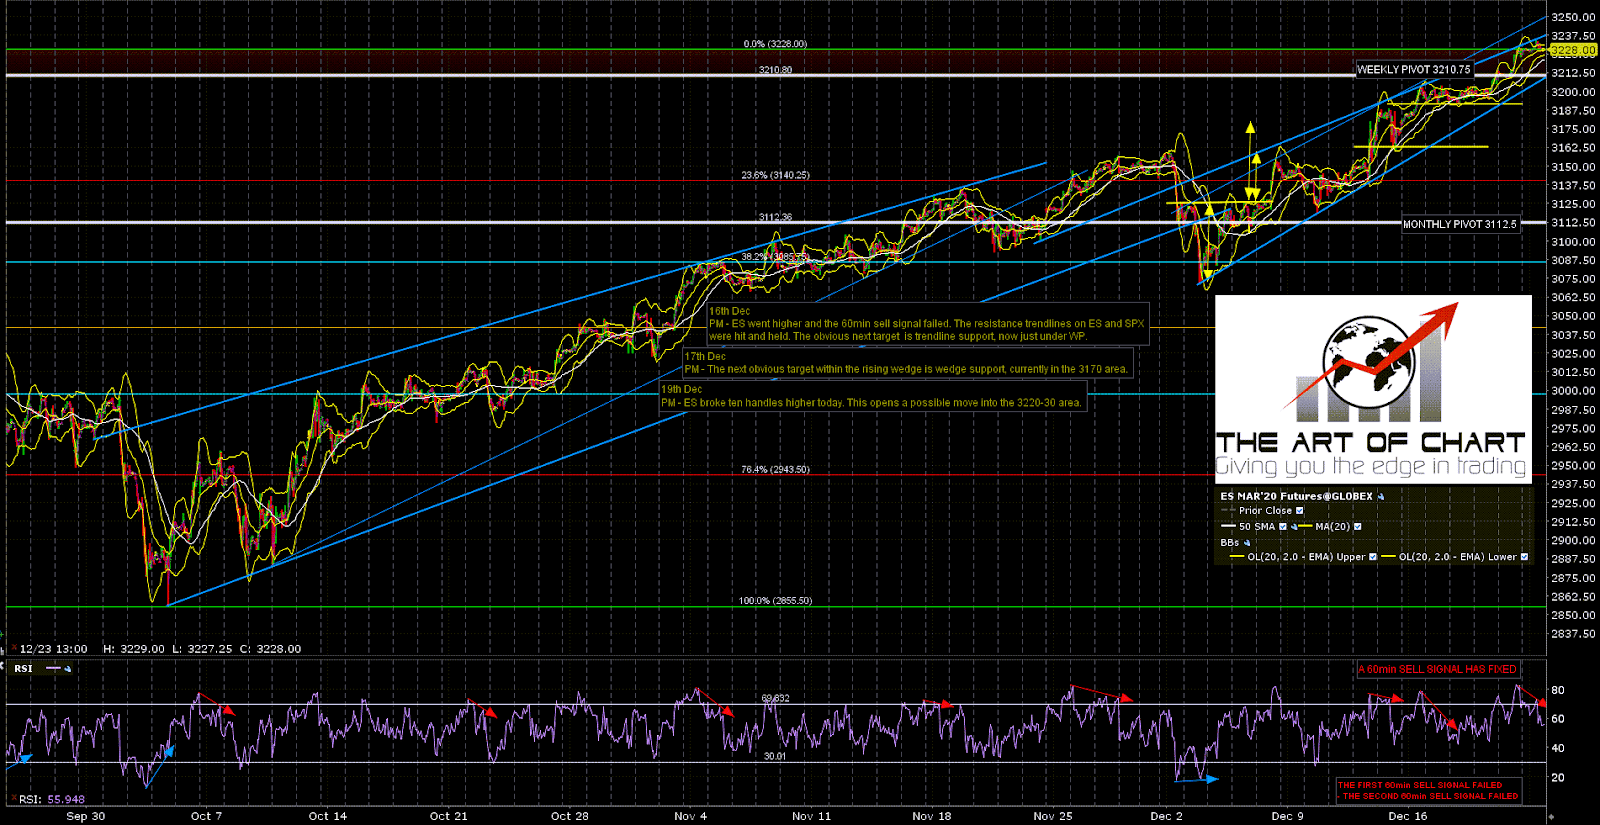
In the shorter term, ES is at short term rising wedge resistance and the next obvious target within that wedge is wedge support, currently a decent match with the weekly pivot at 3210.75. A 60min sell signal fixed this morning.
ES Mar 60min chart:
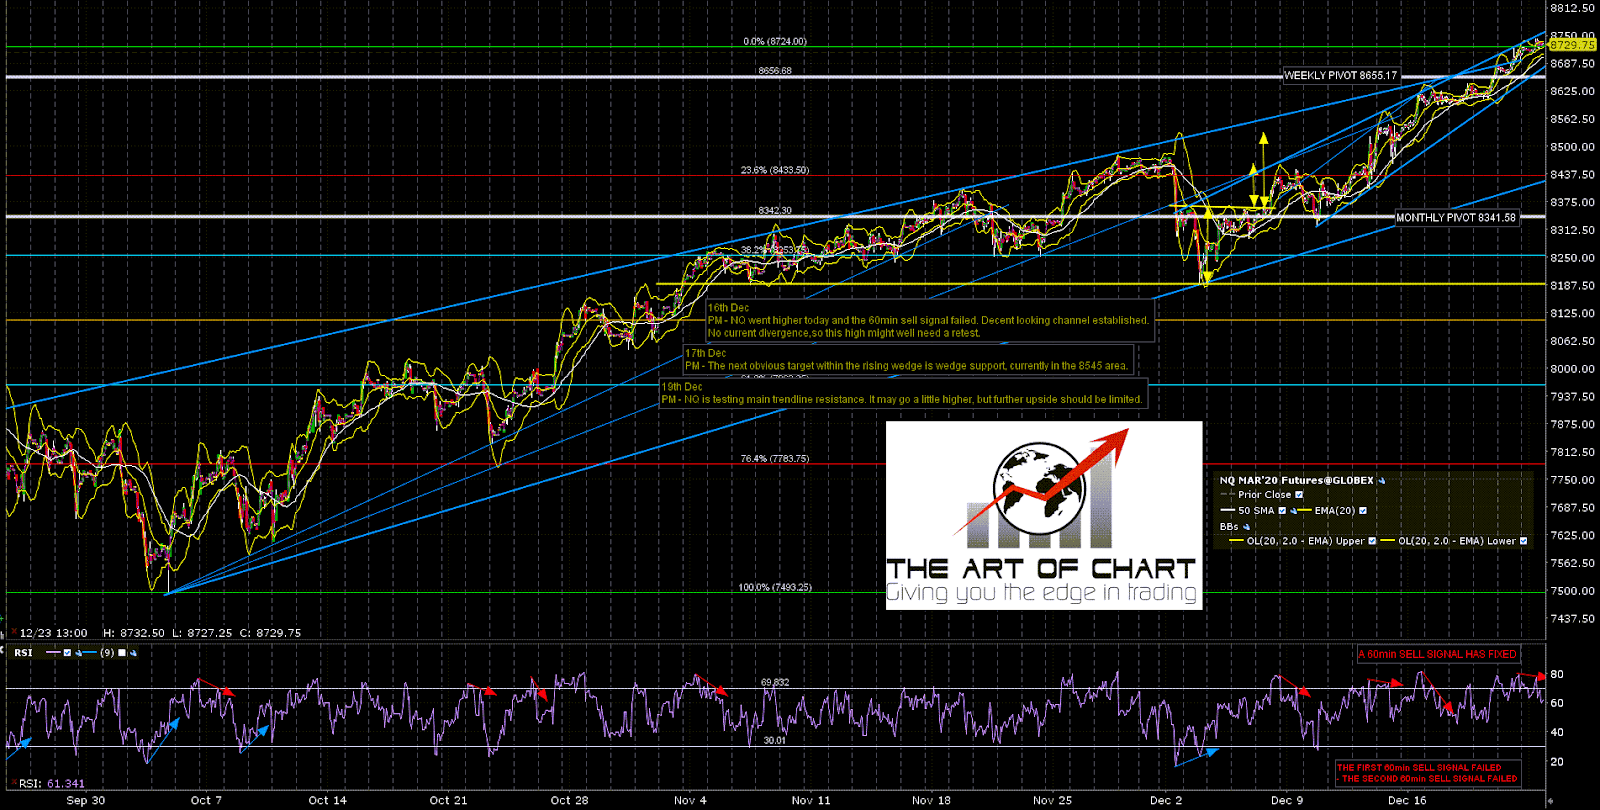
NQ is also at short term rising wedge resistance and the next obvious target within that wedge is wedge support, currently in the 8680 area. A 60min sell signal fixed at lunchtime today.
NQ Mar 60min chart:
As I mentioned, there are now both RSI 14 and RSI 5 sell signals brewing on the SPX chart. The divergence is a bit hard to see on this timescale but it is definitely there and these would be high quality signals.
SPX 60min chart:
On the SPX 15min chart SPX has also hit short term rising wedge resistance and the next obvious target within that wedge would be wedge support, currently in the 3210 area. We’ll see whether these targets are doable on this dull tape, but as a generally rule this setup would be a strong and immediate short setup into at least that target area and possibly as low as the SPX 50 hour MA, now in the 3190 area.
SPX 15min chart:

I’m going to be having a fairly quiet week this week but will be keeping an eye on markets when they are open. If there is anything interesting at all to report I’m planning a post at the weekend, or in any case before the end of the year.
One announcement this week is that we are running our annual end of year sale at theartofchart.net, and as well as the usual two free months for an annual membership, we are offering a further two free months on annual memberships purchased this week. Last chance until June or July next year and if you are interested then you can find that page here.
We will be doing a free public Chart Chat at the end of next week but I’ll put the link to that in my next post. In the meantime, everyone have a great holiday week and if you should find yourself guiltily glancing at the market tape from time to time, know that there are market junkies even more obsessive than you keeping a close eye on the tape this week, even if there’s probably not much of interest likely to happen before next week. Even I will be having a relatively light week. Everyone take care. 🙂
 23rd Dec 2019