
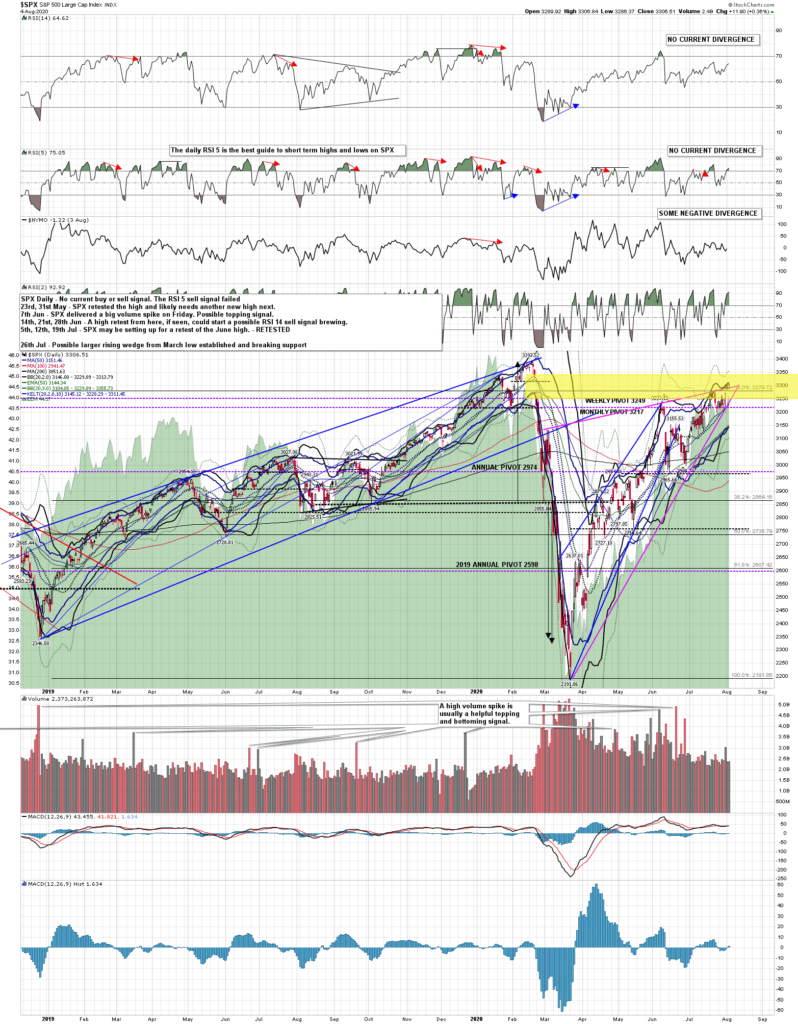
The nice topping setup from my post last week failed to deliver, with SPX finding support once again at the daily middle band, and the very nice bull flag channel on NDX failed to break down as I was hoping it might. Instead it continued to form and delivered the high retest that we have seen this week. So what now? Well the high retests on NDX and SPX have of course set up possible alternate double top setups which are again of high quality, so this is the next important inflection point,and in the event that the SPX daily middle band continues to be solid support, perhaps the last inflection point before a retest of the all time high on SPX.
On The NDX daily chart an RSI 14 sell signal has already fixed, supported by another on DAX daily, but those are the only good daily RSI divergences on indices unless they go higher. On the NDX hourly chart below weak RSI 14 and RSI 5 sell signals have fixed and there is a very high quality possible double top setup here.
NDX 60min chart:
![]()
On SPX I’m watching the high quality rising wedge resistance trendline that I was looking at in my last post and that is overthrowing slightly in what should be a bearish overthrow. I mentioned yesterday that if that trendline was broken then the ideal range to make a high here would be in the 3000-20 SPX area (3290-3310 on ES) and the high today at 3306.94 is in that range. An hourly weak RSI 5 sell signal fixed today.
SPX 60min chart:
![]()
On the SPX 15min chart an RSI 14 sell signal fixed yesterday and is still open and should deliver a move to the target 30 area on that RSI 14. We might well see that directly from here.
SPX 15min chart:
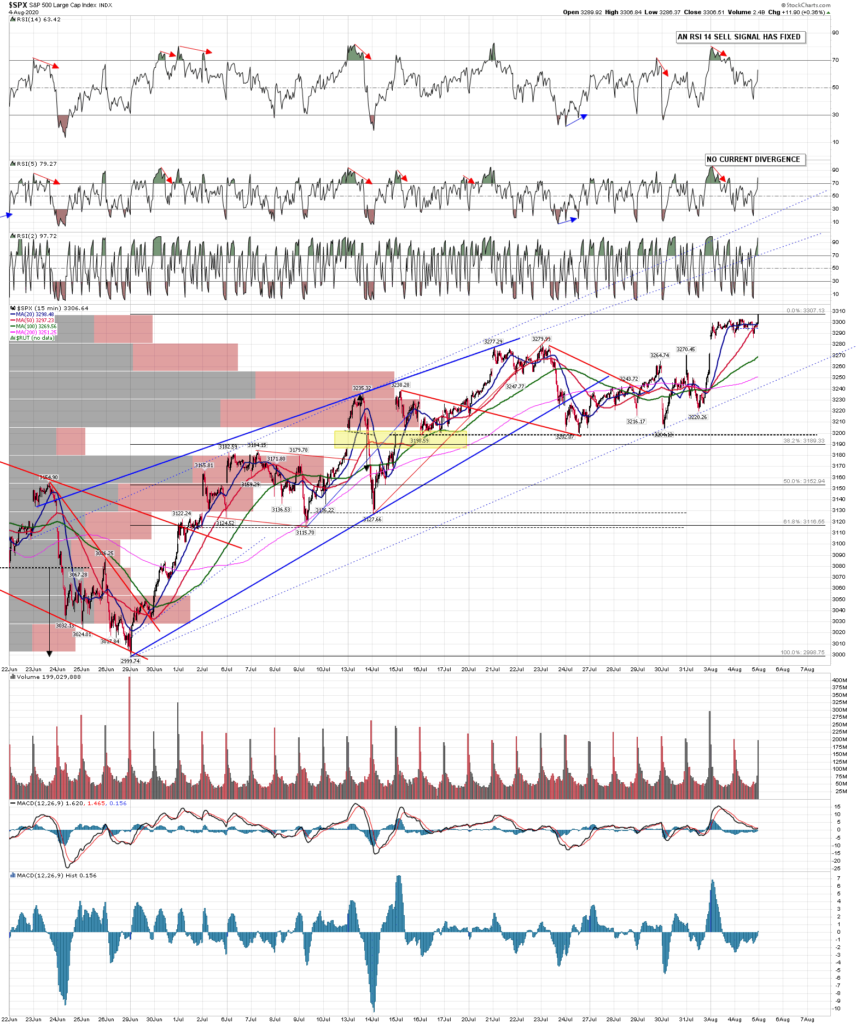
The key support on SPX recently has of course been at the daily middle band, and if that isn’t broken and converted to resistance soon then we are likely to see an attempt to retest the all time high on SPX. If we see another retracement soon, which seems likely, then I’d note that the next test will be a test of three important levels. The first of those is rising wedge support, now in the 3250 area, supported by the 50 hour MA currently in the same area, then the daily middle band, which closed today in the 3230 area. If that can be broken and converted to resistance then there is a high quality double top setup here that on a sustained break below 3200 would look for the 3100 area.
If the daily middle band holds as support again that will open then test of the island top and breakaway gap into 3337.75, and a fill of that gap would clear the path for a retest of the all time high on SPX.
SPX daily chart:
Stan and I are doing our monthly free Chart Chat at theartofchart.net on Sunday 9th August at 4pm and if you’d like to attend then you can register for that on our August Free Webinars page. We’ll be looking at the likely impact of COVID-19 on economies and markets over the coming months and years as well as the usual market analyses. I’ll also be doing a post tomorrow or Thursday looking at the way markets have behaved in past recessions, as the GDP figures last week have now confirmed that this is the steepest recession since records began in 1947. Everybody take care 🙂
 04th Aug 2020