The Options Trading and Investing service provides perspective on high quality setups and option trading strategies for the coming week. We carefully select these setups due to their quality and profit potential and we report back on results. This week we review current positions including the new position in the U.S. Dollar and plan for adjustments to existing positions in Apple and EEM as well as a potential new position in SLV.
Please refer to our education video HERE for more information in the option strategies used in this post.
A summary of the plan for the week is summarized in the video below. The entries and cost basis will be highlighted on this post and on our private twitter feed.
Below is the technical review of the current option’s portfolio positions.
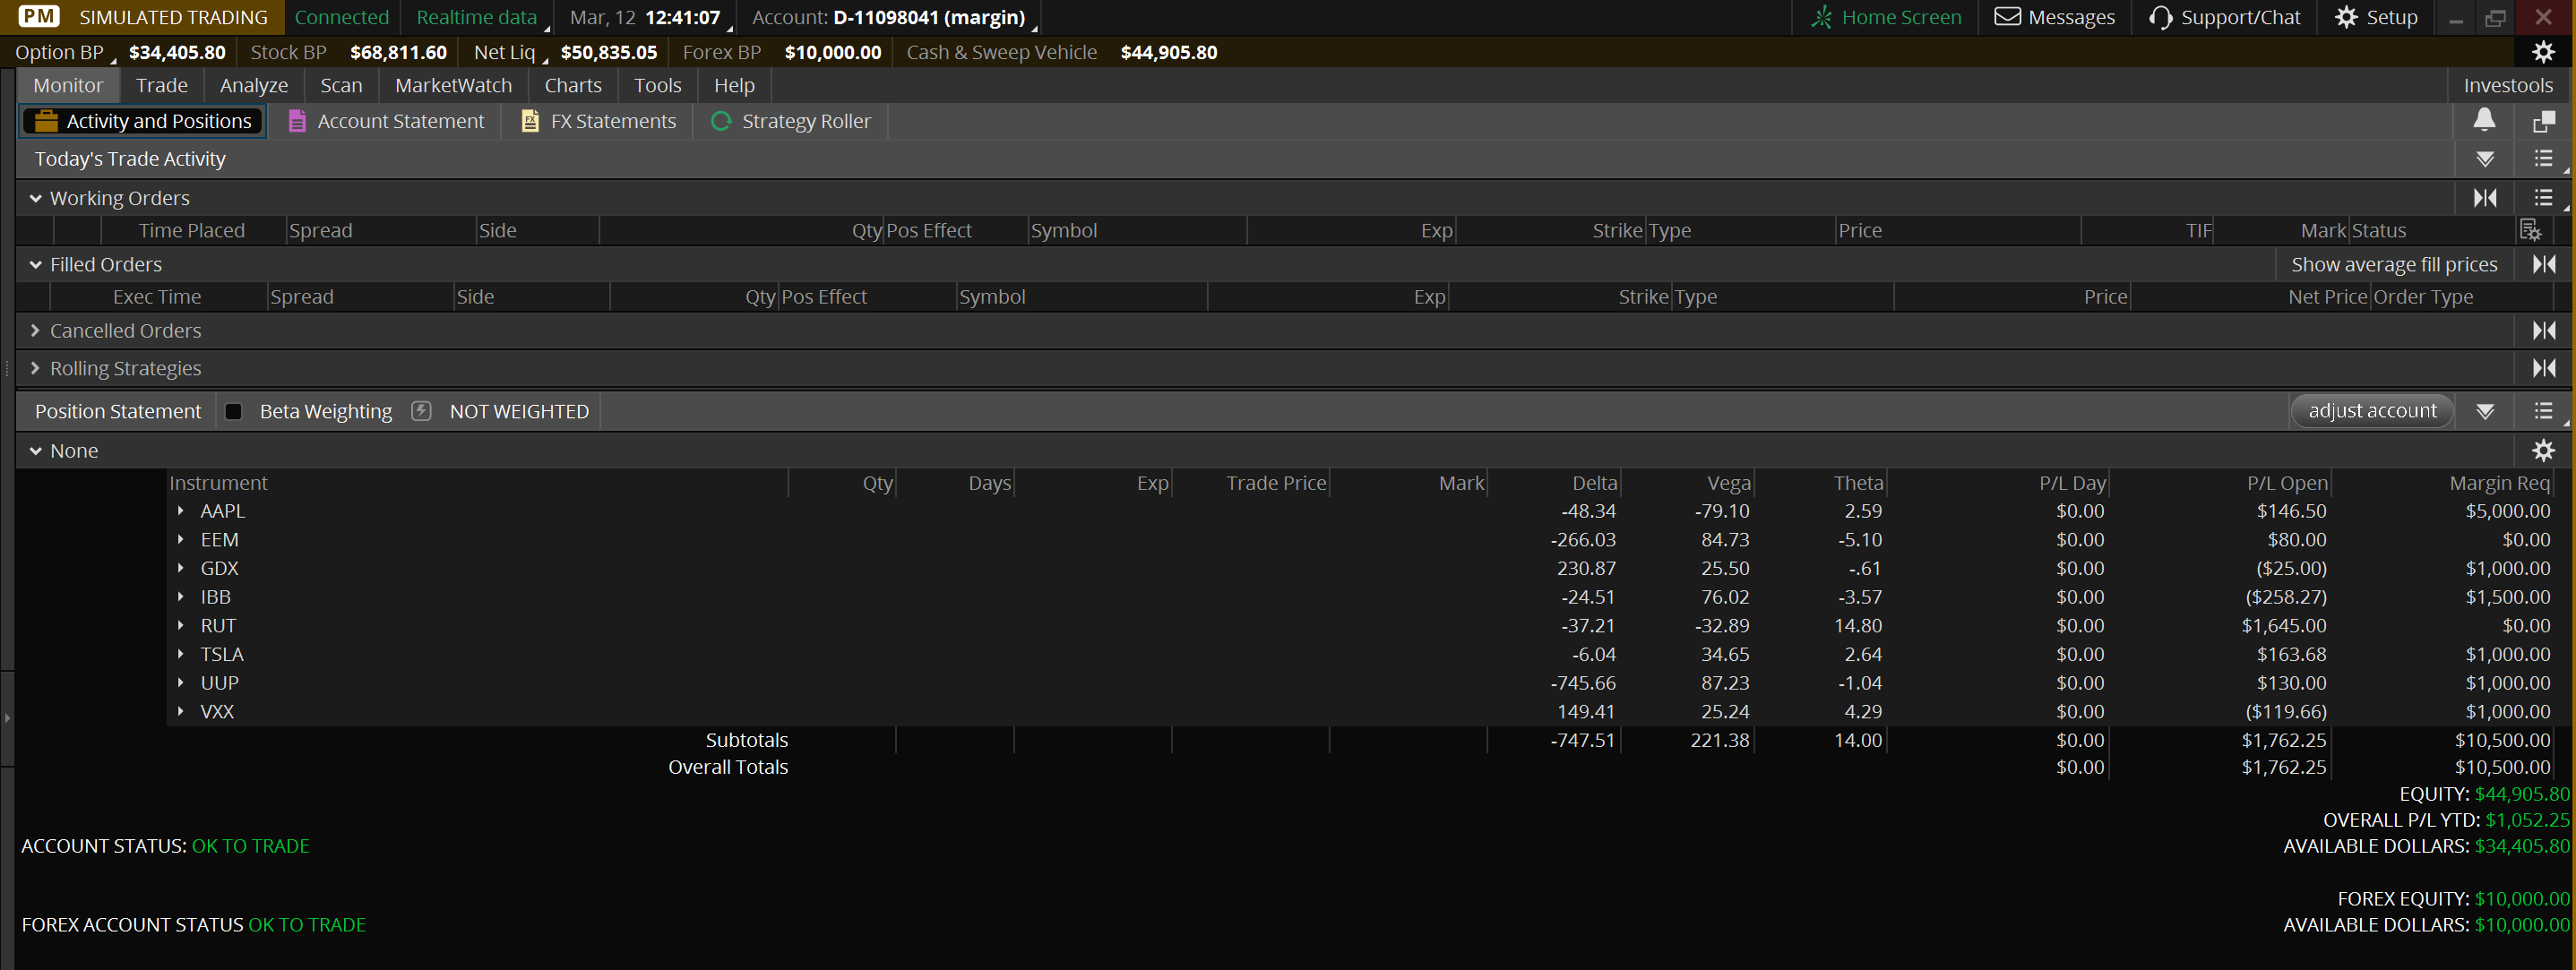
Open profit is $1762.25. YTD Profit is $1,052.25. The difference between the two reflects the RUT hedge that expired on Friday.
By adding a 1×3 Put Ratio Spread for a credit to the portfolio’s current AAPL position, I am not adding any risk to the upside, in fact, I am reducing upside risk slightly. On this risk profile there are 2 XPL (expiration profit/loss) lines. The blue represents the 7/22 expiry and the yellow is the existing XPL of Jan2018. It uses more margin but the portfolio has considerable unused margin. The increased risk of adding the ratio spread is in the opposite direction of the current risk on the position so I am not doubling down. I am however doubling the position’s Theta. Now, if the price of AAPL is moving through the $120 area at July expiry the position should have about a $1,900 profit and then the ratio spread will expire leaving the original position to benefit from a move higher in AAPL into Jan2018. I will also be open to perhaps selling some put spreads when Stan thinks we are closer to making a low in AAPL in the Fall to help make additional upside profits. Ratio Spreads do have unlimited risk to one side of the position so they must be structured correctly. I need to see a CPL that is rising in the direction of where the undefined risk lies (in this position that is to the downside). If I wait to add the Ratio Spread until AAPL is somewhat lower in price, I can collect a bigger credit in establishing the position.

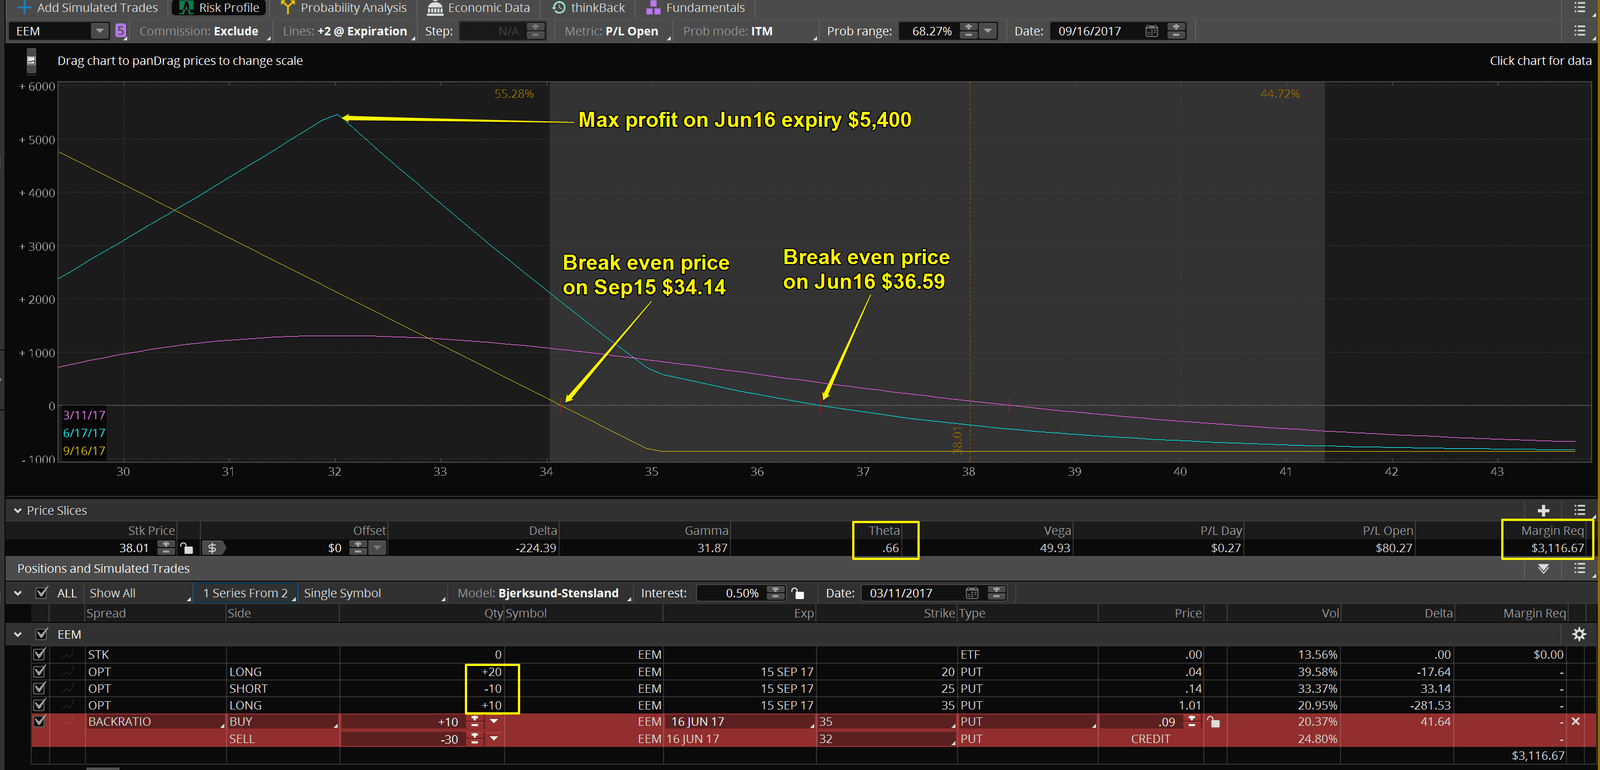
This is the simulated EEM position if I was to add a 10×30 Put Ratio Spread to the current position. As with the AAPL position, I need to collect a credit to avoid adding any additional risk to the upside where all of my risk already exists. This would improve the position’s Theta by almost $6/day currently. Also notice how much the break even price has moved up. Now, a less than 4% move lower by Jun16 makes the position profitable and the position could see a $5,400 profit on a move to $32 by June expiry. Adding the Ratio Spread on a move lower will increase the credit that I will receive for establishing the position. One other future adjustment I have planned to bring in additional premium is due to the fact that I bought a 20 lot of the Sep 20 puts for a total of $80. As EEM heads lower, I will look to sell additional puts between the 30 and 20 strikes to generate additional Theta.
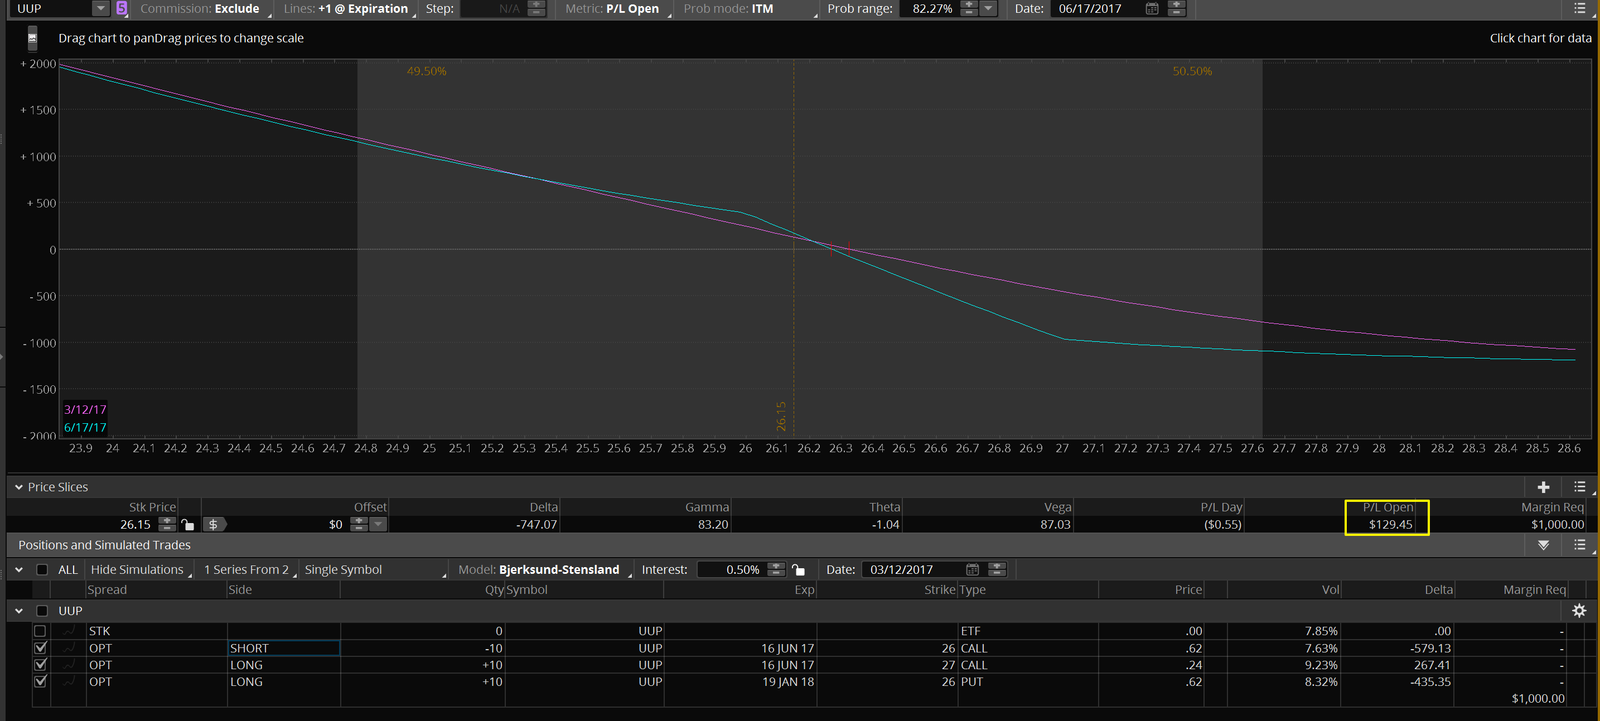
The option portfolio added a new position in UUP (U.S. Dollar ETF) on Thursday, March 9th. The open profit is $129.45 and the margin requirement is $1,000 as of the 3/10/2017 close. The maximum loss on the position is $1,240 which is 2.5% of the $50,000 portfolio value. In the video I break the overall position down into the 2 component positions. The position had a 10% gain on Friday alone even though UUP was down less than 1% on the day due to currency leverage.
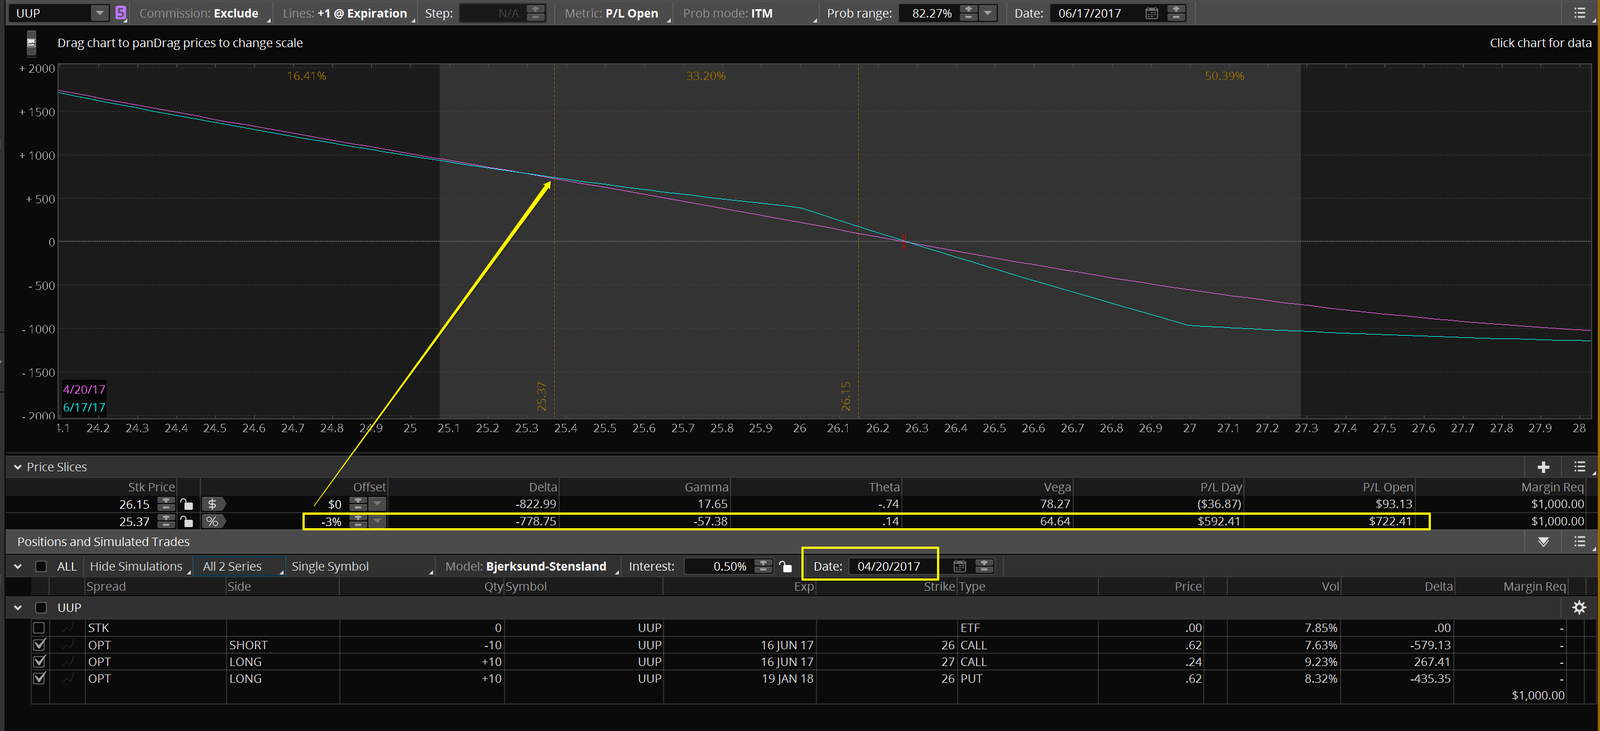
Below is an approximation of what the position will look like on a 3% move lower as of 4/20. The expected open profit will be around $700. Anticipating a retracement at that point means I would give back much of that profit while UUP moved higher. To see what adjustments I would make, let’s look at the components of the position again.
Below is the short call spread projected as of 4/20. I expect that the position will have a $300 profit on a 3% move lower in price. The max profit on the spread is $380. That means the position will have realized about 80% ($300/$380) of it’s max profit. What is the max loss on the spread? That is still $620. So, at that point, with the position up $300, I could give back that $300 profit plus lose the max $620 of the original risk of the spread. So I would be risking a draw down of $920 in order to make an additional potential $80 of profit. Does anyone think that would be wise risk management especially when Stan is projecting a bounce in price around then? I would plan to close this spread during the 4/20 low window.
I constantly monitor my positions for the current reward/risk to determine when to close or adjust.

When UUP reaches the -3% target price by 4/20 I will look to sell a 15 lot of the Jan2018 24 puts for approx. $.19. That would take $285 of risk off of the $620 cost of the long puts that I purchased. I will also consider selling a 10 lot of Jan2018 25/26 call Vertical Credit Spread for around $.51. It is most likely however that I will wait for Stan’s anticipated bounce from the 4/20 low window and sell the call credit spreads in the May high window. Waiting to sell the spreads in May will bring a greater credit. I will also strongly consider selling the credit spreads using the Sep expiry. I will evaluate all of those adjustments around the 4/20 low window.
In summary; I take advantage of Stan’s price and time targets to plan my option position adjustments well in advance. Just like in chess, I always want to be thinking 2-3 moves ahead.

Below is the potential SLV position. Designed for a move to above $19/share by Jun16. How is max loss and profit calculated on a debit vertical spread? Max loss is the amount paid to purchase the spread. The max profit is the width of the spread less the debit. Here, the spread is $3 wide. The debit (as of Friday’s close) was $.72 so the max loss per 1 lot is $72 and the max profit is $228. Reward to risk ratio is about 3/1 due to relatively higher value of the calls that I am selling vs. the calls that I am buying. Relative value of options is determined by comparing the implied volatility (vol) of the options. When possible, I want to buy lower vol options and sell higher vol options to improve my reward/risk ratio.

 12th Mar 2017
Excellent analysis! Paul – how could one receive tweets on these trades? May I request you to please share the Twitter user that I need to follow.
Satish, the option trades are tweeted out through @art_of_chart. It is a subscriber-only twitter feed. If you are not currently a subscriber you should consider trying the service. You can sign up for a free trial of the ‘Trader Triple Play’ and have access to Traders Charts, Chart Chat and Daily Video Update as well as the live Twitter feed.