Occasionally there is a year so awful that nothing seems to go right. The title phrase was first used in a Church of England publication in 1870, the year that papal infallibility was declared, Prussia invaded France, Italy annexed Rome, Lenin was born and the US weather service made their first official forecast. 2020 is another year worthy of the name (meaning horrible year in Latin), with COVID-19 having ravaged the world in a serious and lasting health and economic disaster.
This hasn’t been a great year for me either, with my marriage ending acrimoniously, though that end had at least been a long time coming, and then I received the news this morning that my beloved sister was killed last night by a drunk driver in London. She will be sadly missed by many including her three barely grown children though the funeral will have to be small due to COVID-19 restrictions. This really has been a bad year and I really won’t be sorry to see the back of it. This also adds a sister killed by a drunk driver to my existing tally of two close friends killed by (their own) alcohol problems in their 40s. That’s high, though a 2017 study found that the annual deaths worldwide from alcohol abuse are about 15 times higher, and the deaths from tobacco about 5 times higher, than the total deaths from all illegal drugs, which makes those last deaths from illegal drugs essentially a small rounding error on a much larger substance abuse problem involving legal drugs. Thought for the day.
Onto the markets where I think that the likely retracement on SPX that I’ve been predicting has started, though there may still be a high retest or two as larger topping patterns form. Just to review those charts across multiple timeframes then.
On the SPX monthly chart the recent punches over the monthly upper band historically favor a topping process that at least heads back to the monthly middle band area, currently about 3124.
SPX monthly chart: 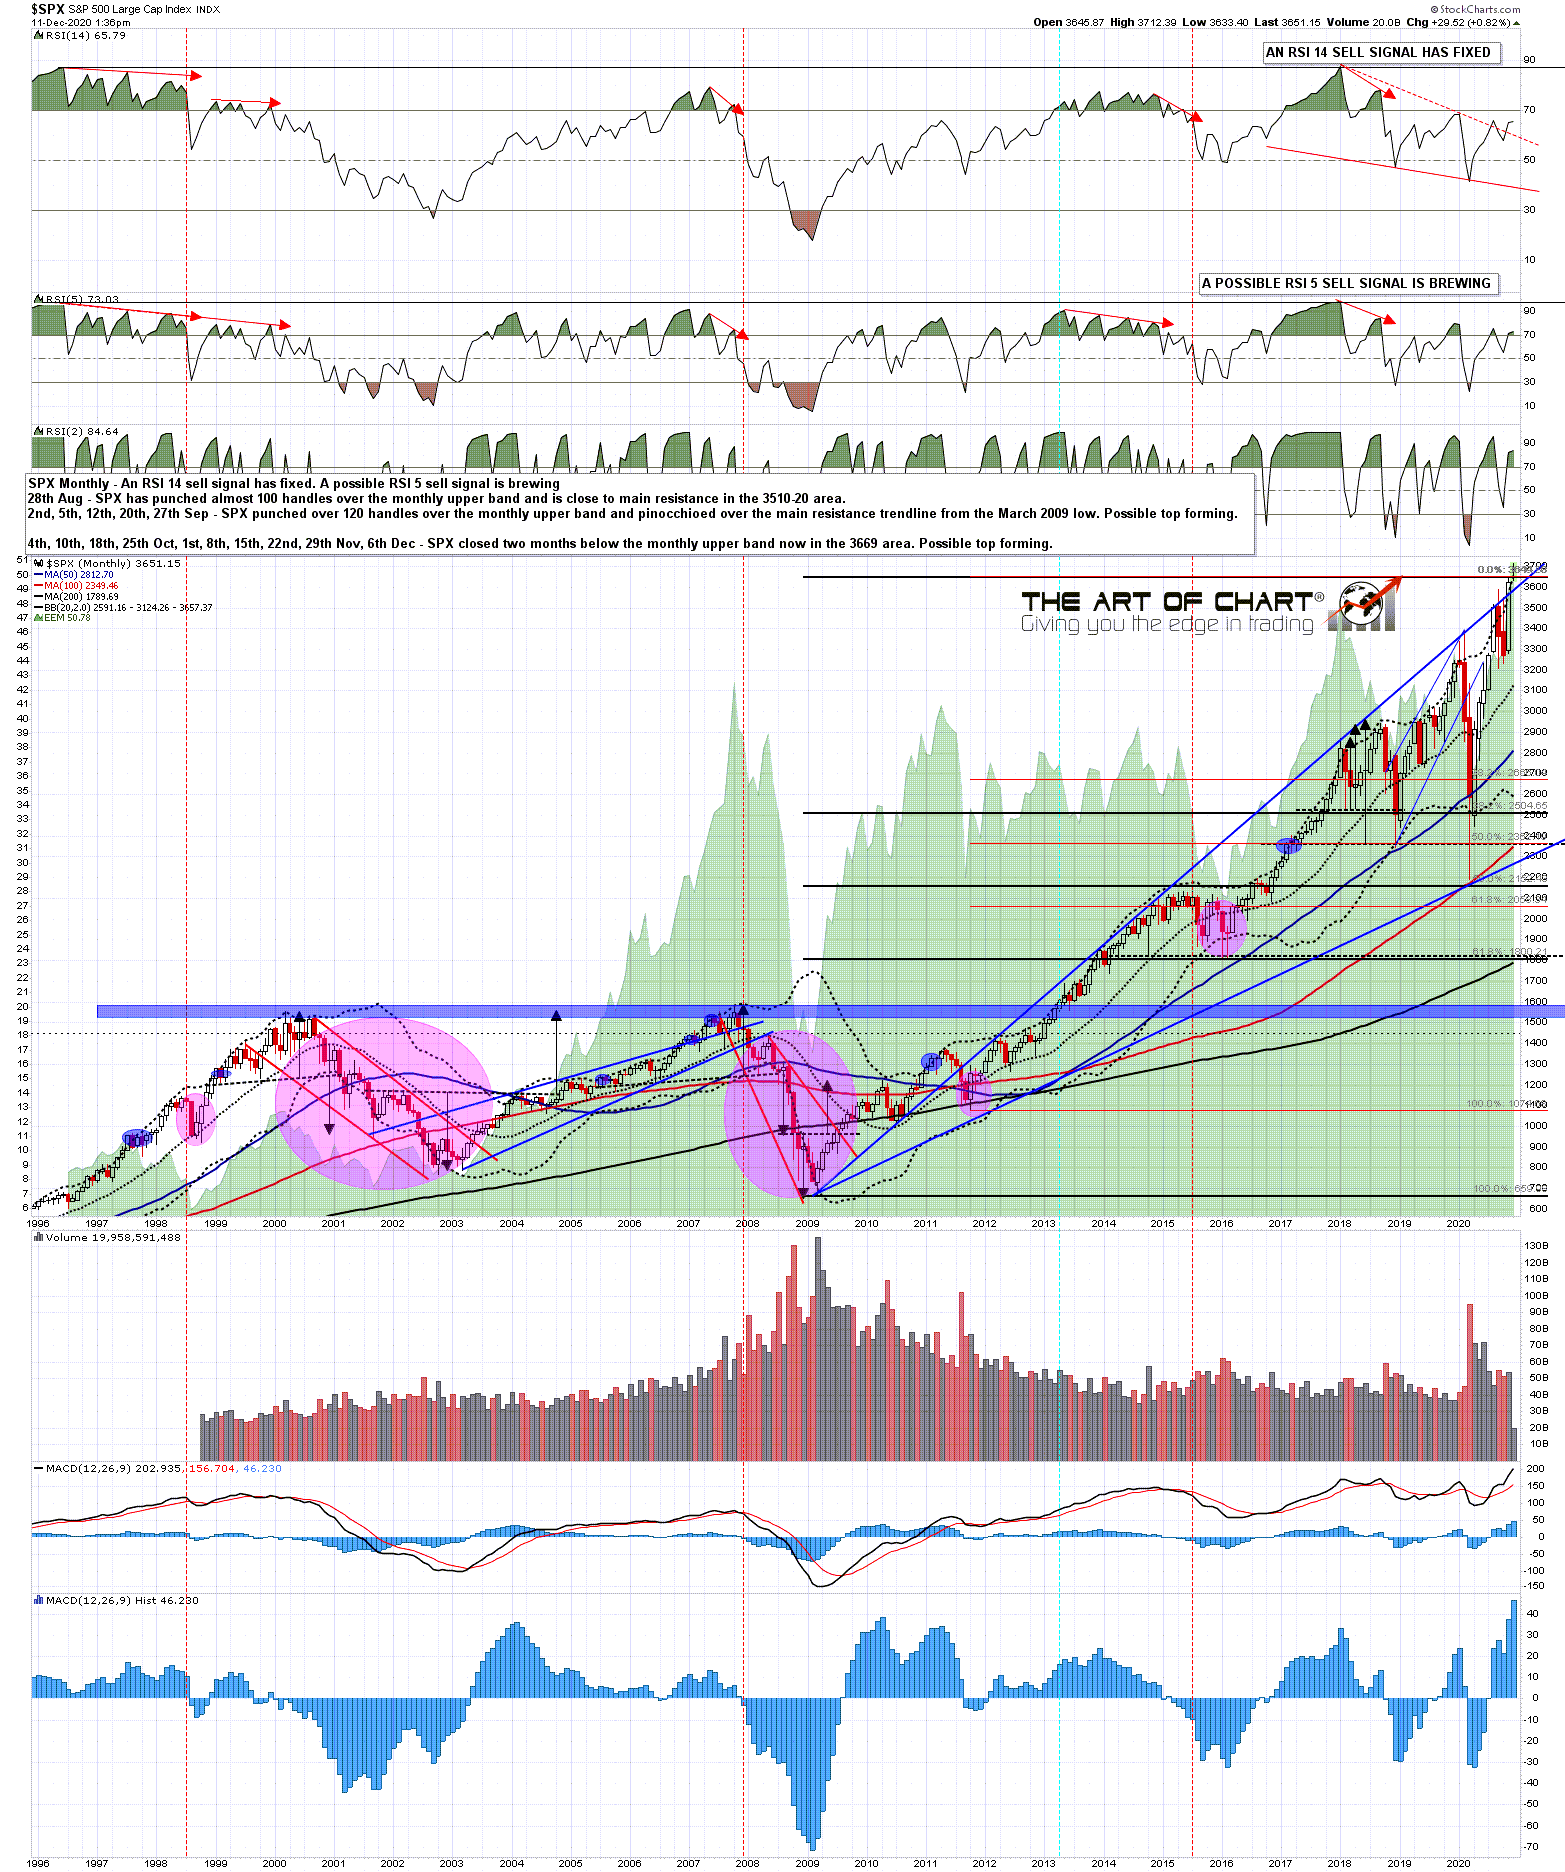
An RSI 5 sell signal has fixed on the daily chart that is getting close to target, but hasn’t reached it yet, suggesting that SPX may retrace further short term. The low today was a test of decent support at the daily middle band, which could deliver a high retest if we see a strong enough rejection there.
SPX daily chart:

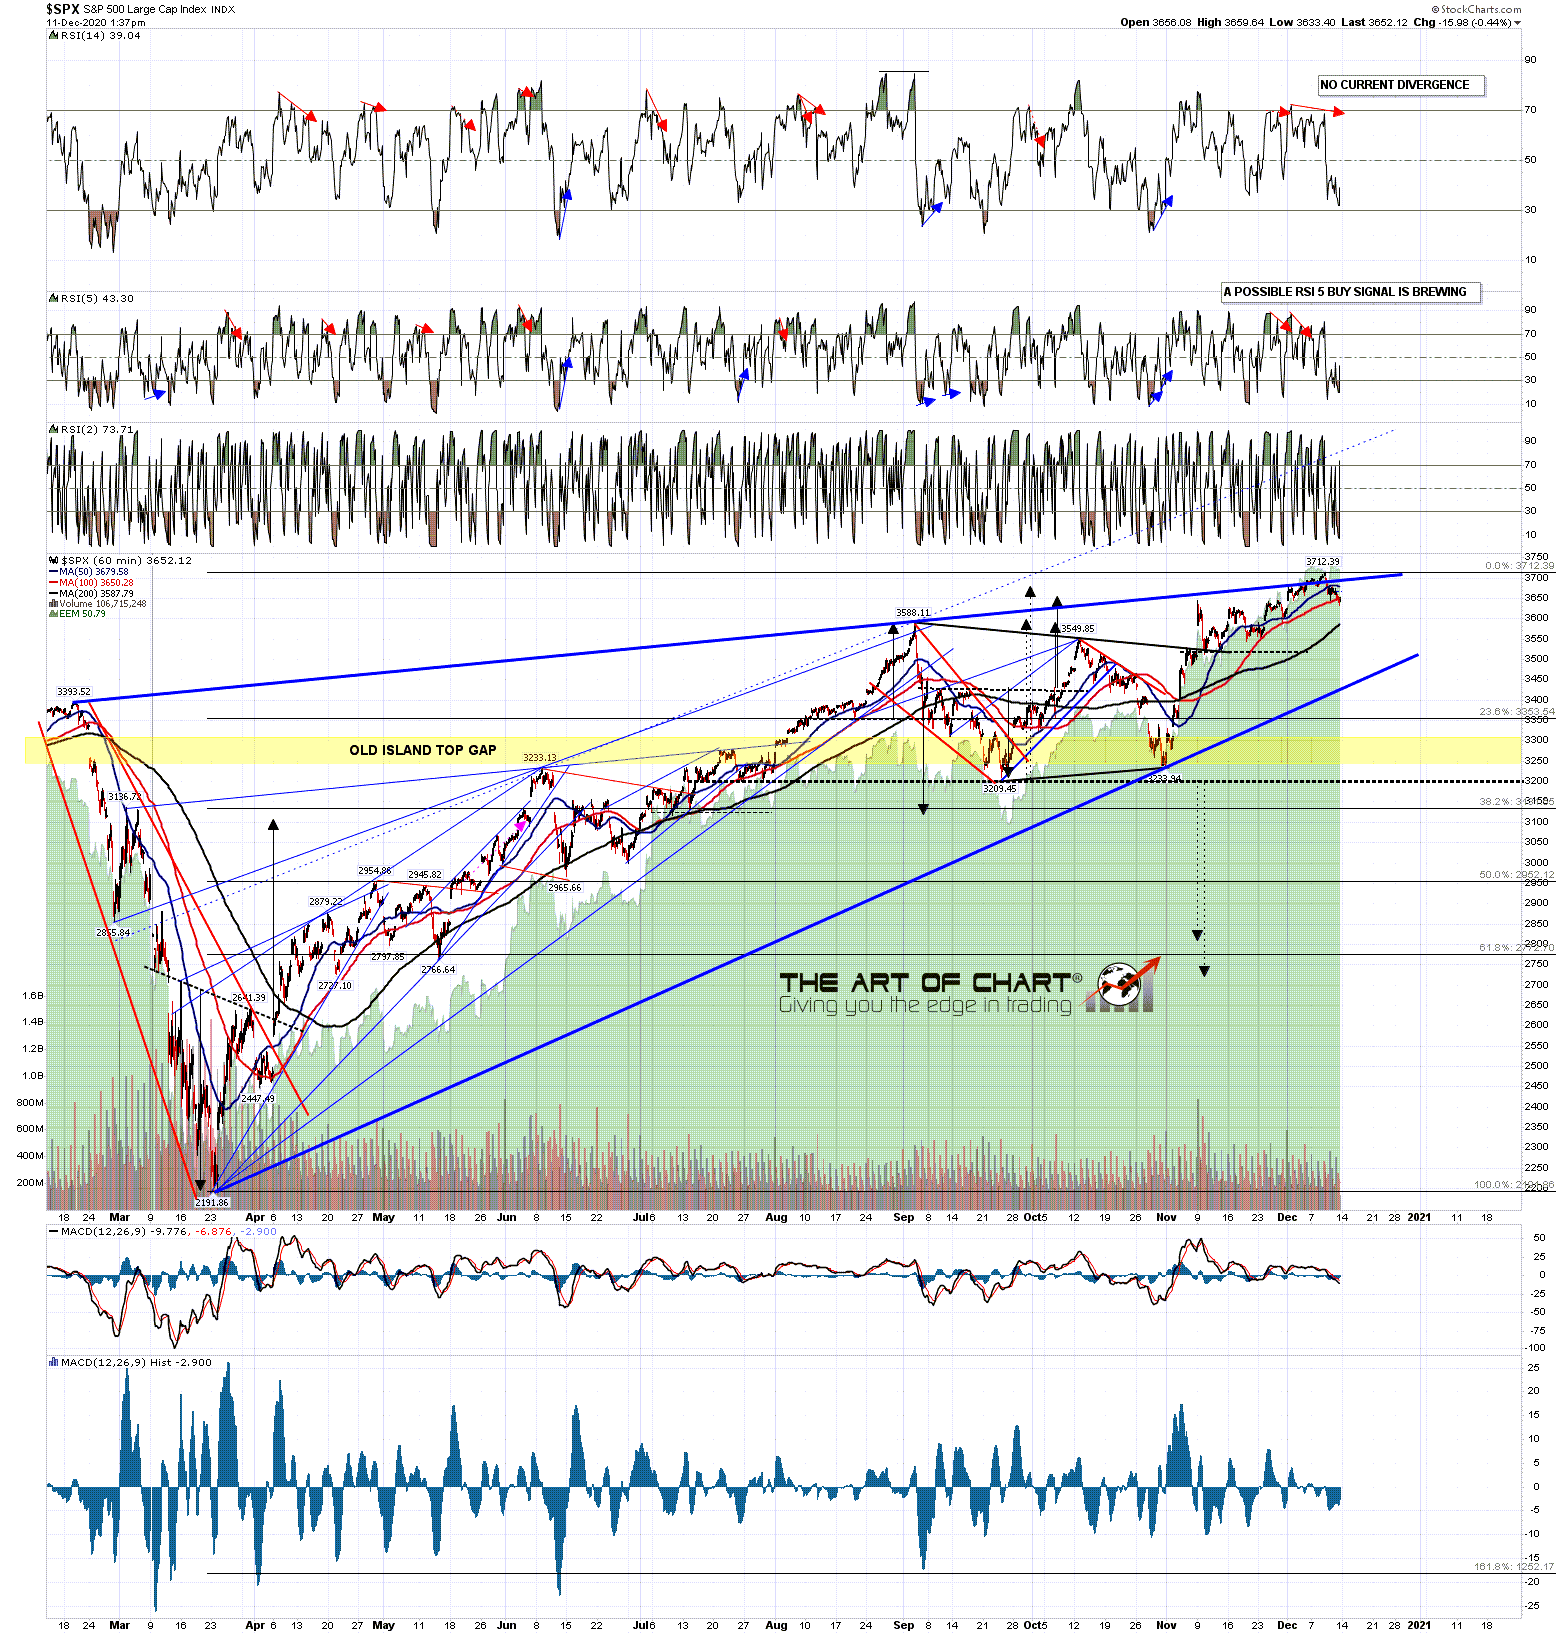
On the hourly chart SPX has formed a beautiful rising wedge from the March low that has overthrown bearishly and should now be returning to rising wedge support, currently in the 3420 area. The bearish overthrow suggest that will break at or soon after that test and open a minimum likely retracement of 38.2% of the move up from the March low. That target would be in the 3130 area, and if you’re thinking that area sounds familiar, I’d note that the monthly middle band target is currently just six handles lower.
SPX 60min chart:
In terms of the shorter term pattern setup a very high quality H&S was forming on both SPX and ES into the close yesterday, and then broke down overnight with a target in the 3575 area on SPX and 3570 area on ES. Of course whenever a pattern like this breaks down there is an inflection point where the trading instrument can reject back up into the previous highs (all time high retest here). There are two levels I would be watching to signal that rejection. The first is the H&S right shoulder high at 3674.97, as a break above invalidates the H&S. The second is the 50 hour MA on SPX, currently at 3679. A break and conversion of that 50 hour MA back to support opens the all time high retest.
SPX 15min chart:

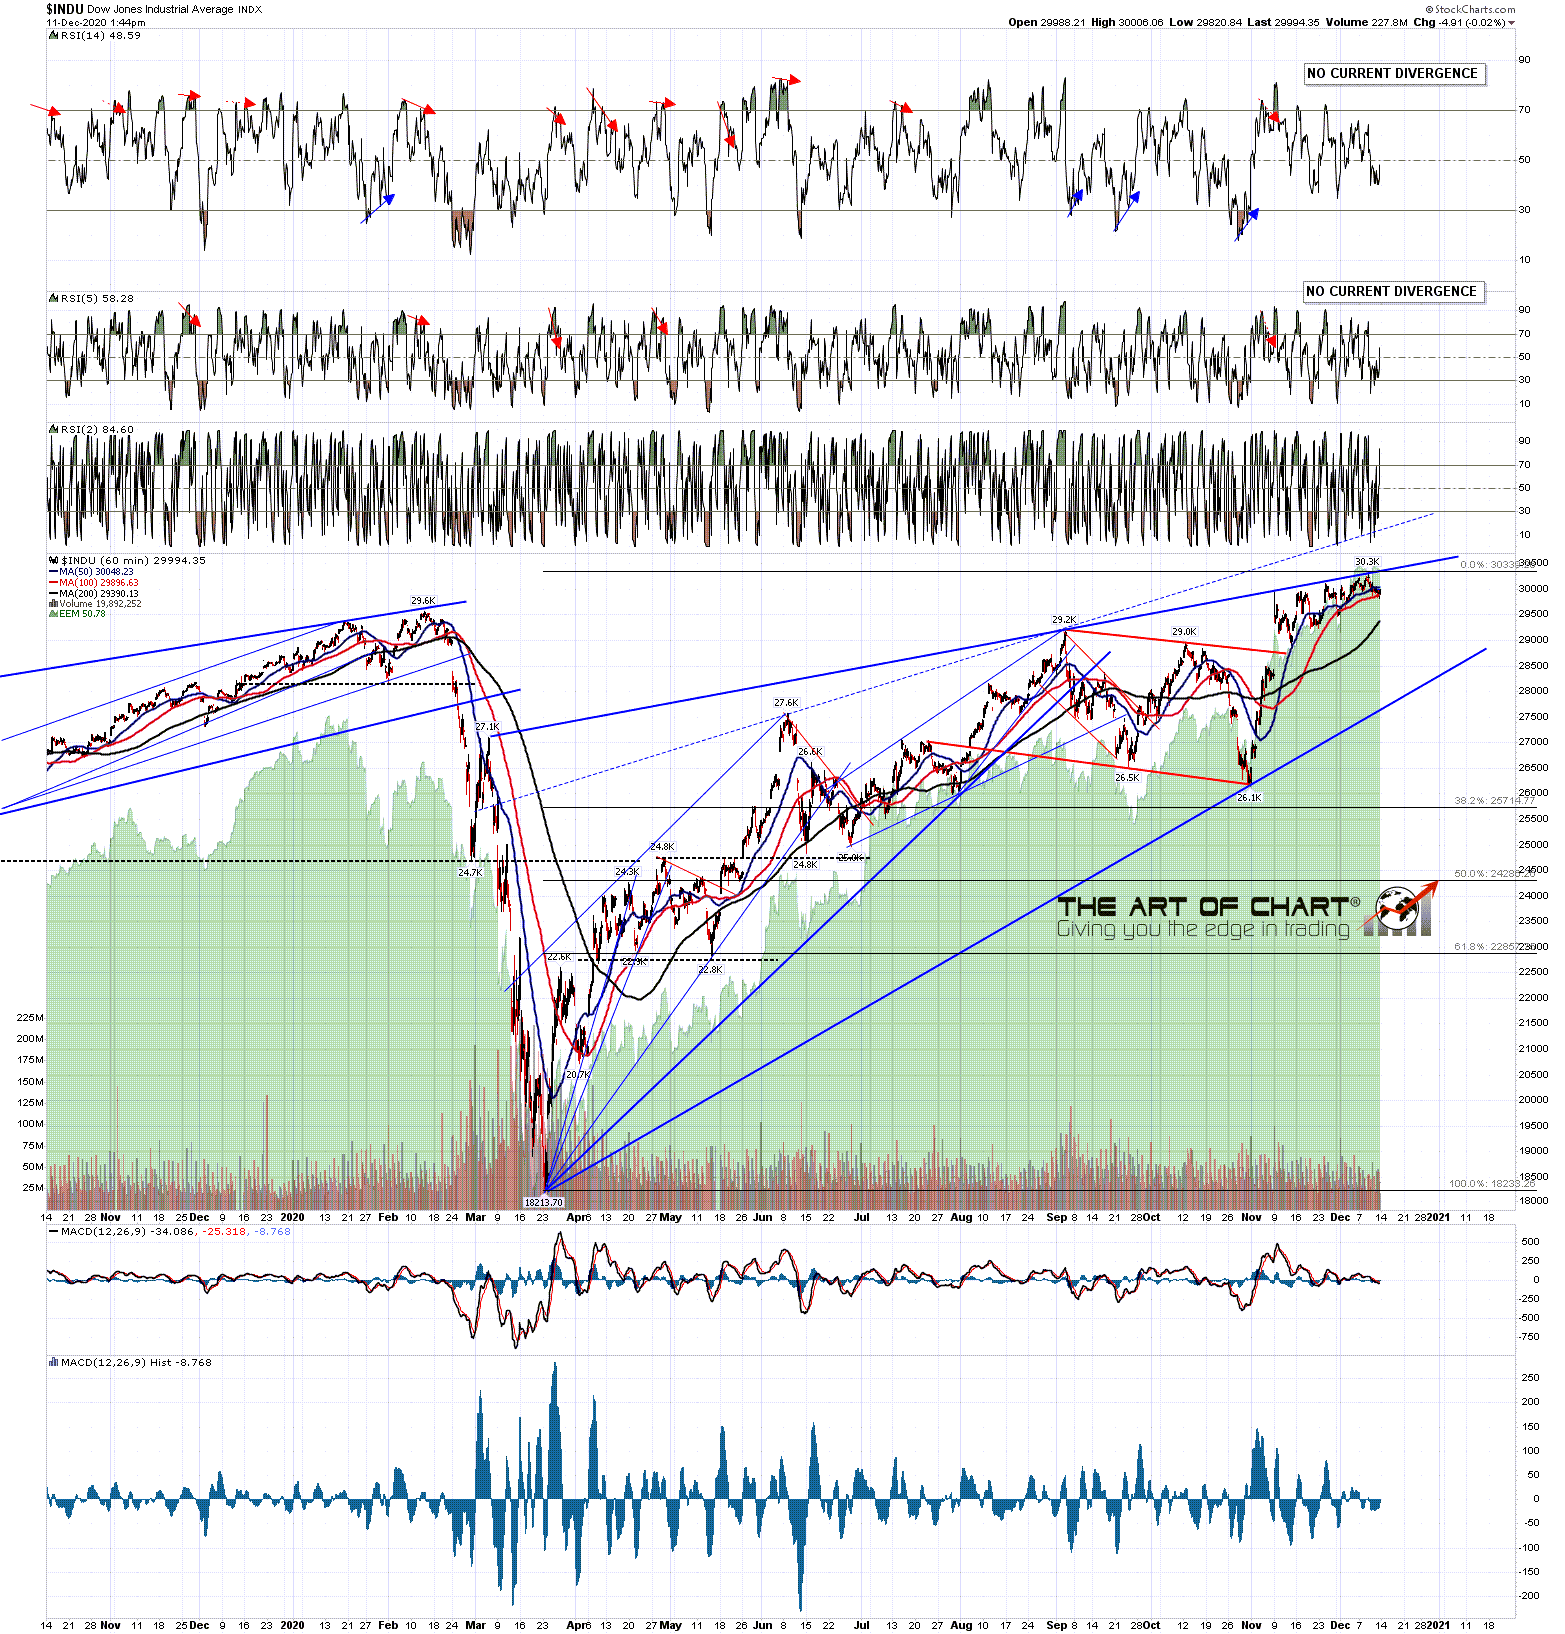
What else supports my overall view here? Well there are a number of things, but by far the prettiest is the beautiful rising wedge on Dow from the March low. I’ve been following and posting this for weeks now and it really is a beauty. So far it is delivering very well, and likely that continues to be the case.
INDU 60min chart:
Why am I working today when my sister was killed last night? Well I tend to work when I am feeling happy, as I enjoy it, and I tend to work when I am feeling sad, as I find it takes my mind off other problems. All in all I don’t tend to take many days off work.
We had to delay the webinar scheduled for last night so we are doing our next free public Trading Commodities webinar tonight at theartofchart.net an hour after the close today. We will be looking at interesting trades on oil, natural gas and gold. If you’d like to attend you can register for that on on our December Free Webinars page. If you can’t make it the recording will be posted on the same page later tonight.
 11th Dec 2020
My prayers are with you – lost a sister myself 10 years ago.
Regards,
Stuart Smith
So sorry to read of your recent loss.
So sorry Richard!
Richard, Very sorry for the tragic loss of a beloved family. Deepest Condolences from a long time subscriber.
Jack, hope you got my Tweet on Friday. My sincere condolences on your loss…
never easy. thoughts and prayers with you…
Phil….