I was looking at the tests of the main resistance trendlines on SPX and ES on Monday, and at the possibility that SPX might turn down there. Instead it broke through, dragged upward by tech stocks, and the very nice daily RSI 5 divergence on both SPX and NDX was lost.
On both SPX and ES, price is now slightly above the main resistance trendlines in what may be a bearish overthrow.
SPX daily chart:
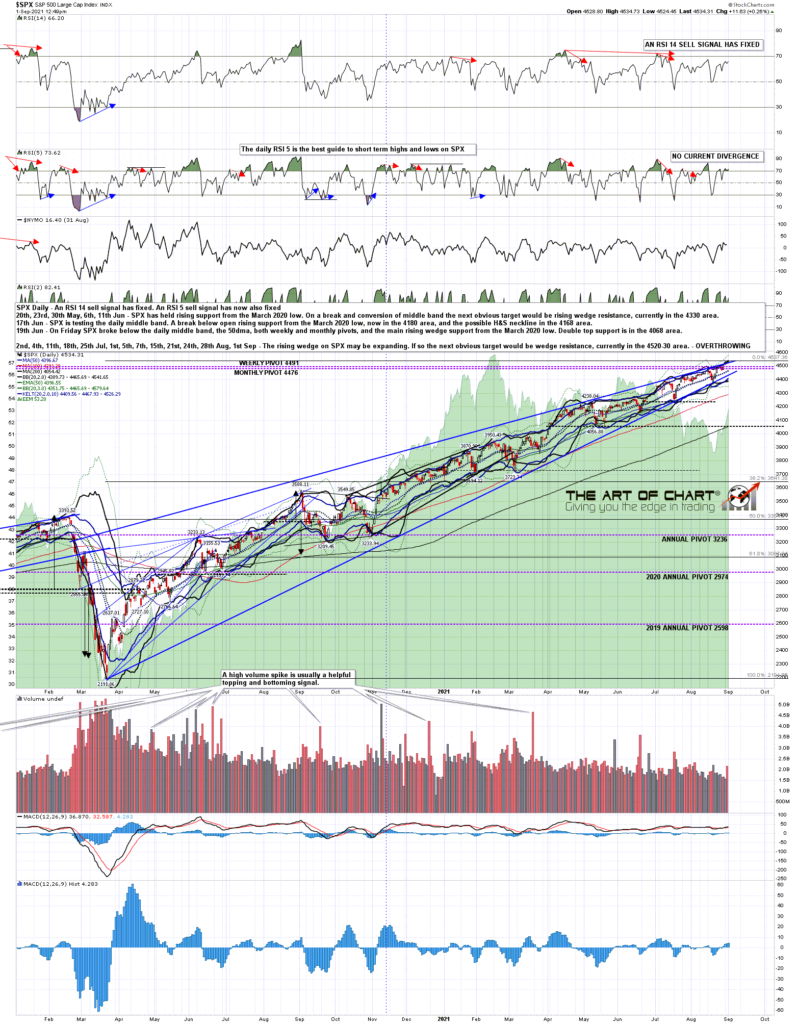
In the short term there is now a very clear rising wedge from the mid-August low at 4367. The rising wedge support trendline was confirmed with a perfect third touch at the intraday low on SPX yesterday, and I posted it shortly after that on the private twitter feed at theartofchart.net shortly after that, with the observation that unless that wedge support trendline broke, I was looking for at least a retest of the all time high, with the intraday high today just short of that so far.
If SPX continues upwards then that wedge resistance is now in the 4560-5 area. If SPX breaks the wedge after a marginal new all time high then decent negative divergence will have been re-established on the hourly RSI 14.
SPX 60min 2Mo chart:
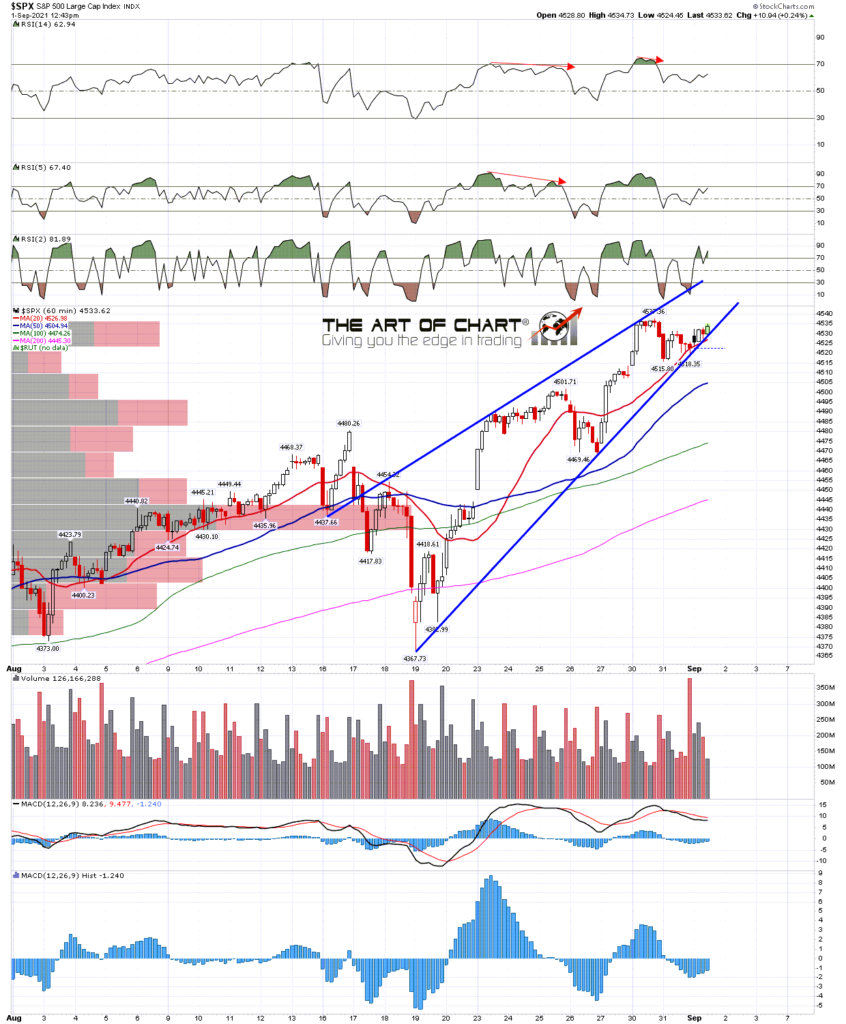
Is there a a decent case for getting as high as the 4560-70 area on this move? Well there is an argument that there is another target trendline up there. Breaking down the move from the low on SPX in March 2020 into the three obvious waves, the third one started in September 2020 at the second wave triangle low at 3209.45, with the current support trendline starting from the early November low at 3233.94.
From that low there is a decent looking possible rising wedge as well, and the most obvious resistance trendline for that wedge is currently in the 4570 area.
SPX 60min 13Mo chart:
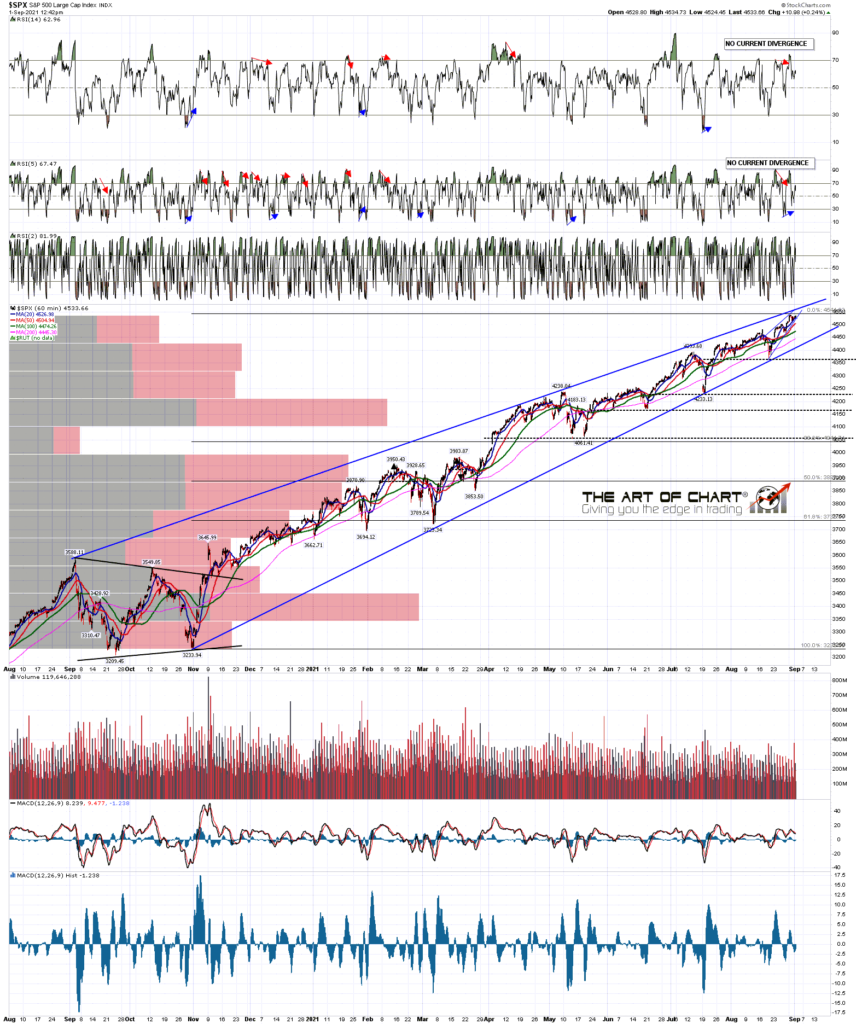
I was looking at mean reversions on SPX a year ago, and was noting that the usual levels reached above the 45dma before a reversion back to it historically tended to be in the 3% to 4% area, but had expanded after the March 2020 low as high as the 8% to 9% area.
Since the September 2020 high that has reverted back to normal and of the six retracements back to the 45dma this year, all were in the 3% to 4.25% range above the 45dma at the preceding high. At the current all time high that would be towards the bottom end of that range in the 3.1% area. If we see a move to the 4570 area that would be close to 4%, still in that range. The 45dma is now in the 4410 area, effectively at rising wedge support from the November low, making that the key level that has to be broken and held to open a larger retracement.
I’ve drawn a draft elliot wave structure in patterns on the chart below. The first wave was a rising wedge from 2191.86 to 3588.11. The second wave was a clear triangle and the third wave is a likely rising wedge from 3209.46 to 4537 so far. All decent patterns and suggesting that we may need to see a fourth wave (non-triangle as wave 2 was a triangle) retracement soon, and then a wave 5 up before we see the strong retracement that might deliver the 3800 area backtest I’ve been looking at. We’ll see.
SPX daily vs 45dma chart:

Right now there is a case for a reversal from a full retest of the SPX all time high, not quite hit so far today, as there would then be a decent possible small double top setup and possible hourly RSI 14 sell signals brewing on both SPX and NDX. If not, then we may see a move directly up to the double trendline target in the 4570 area later this week.
The free public webinar scheduled for last Thursday had to be delayed a week and is now scheduled for an hour after the close tomorrow on Thursday 2nd September at theartofchart.net and will looking at the usual six big tech stocks and eleven sector ETFs, many of which are looking particularly interesting here. If you’d like to attend you can register for that here, or on our August Free Webinars page.
 01st Sep 2021
Great post and love the various options. Are turns normally this stubborn? We have been looking for it since October of last year.
We’re in uncharted territory here economically. Until 50 years ago the western world had been on some variant of the gold standard for currency since the middle ages. Never have we had governments and central banks as willing to spend and print money as these. The effect on the stock market has been extraordinary.
If we get the retracement to 3800 area that I’d like to see, that may be the springboard to get SPX to 6800. After that we’d have to see, but the US debt is reaching levels relative to GDP which would historically call the likelihood of repayment into serious question. That ratio seems likely to rise significantly over the next few years.
Hard to see how this ends well, but the problems can likely be kicked down the road a few years longer. Interesting times. Jack
Thanks for the reply. I think NFP reaction confirms the unprecedented times we are living in. It surely seems until the bond market can break 1.75 to 2 on 10y equities enjoy such a melt up. Will be interesting to see if this move breaks the 410 day record of 2018. Appreciate your insight. Have a good one