Welcome to The Weekly Call, your source for high-quality commodity setups and trading strategies. Since October 2016, our approach has delivered an impressive 777% return, and we’re here to share the insights and methodologies that drive these results. In this blog, we’ll explore the latest market trends, provide actionable trade setups, and offer a deep dive into the global economic factors influencing commodities like sugar, coffee, live cattle, and gold. Whether you’re a seasoned trader or new to the market, our analysis is designed to help you navigate the complexities of futures trading with confidence.
The global economy is showing clear signs of slowing down, and concerns are growing that this slowdown might become too severe. However, there is a silver lining: inflation appears to be gradually easing. Recent reports indicate that prices for food and agricultural products are starting to soften at the consumer level. While this is a positive development, it’s important to note that inflation, especially for food, will take time to fully decrease throughout the entire production and marketing supply chain.
Consumers, understandably, are frustrated that the drop in food prices hasn’t been as significant as the reductions in the prices of the underlying commodities. Over the past 14 months, we’ve seen considerable declines in the prices of various commodities: corn is down by 27%, soybeans by 22%, soybean oil by 66%, cattle by 7%, hogs by 12.5%, nonfat dry milk by 30%, butter by 10%, sugar by 52%, gasoline by 11%, and natural gas by 44%.
There are also signs that commodity prices might be reaching a bottom soon. These include a shift from neutral to more dovish policies by global central banks and indications of a weakening dollar. However, the process of commodity prices bottoming out can be prolonged, with significant sideways movements in the market charts. This means that while prices might not fall much further, they could hover at current levels for some time before any meaningful recovery occurs.
In summary, while the global economy is slowing and inflation is easing, the recovery in commodity prices could be slow and drawn out, especially given the current economic conditions and the state of the Chinese economy. Traders and consumers alike should prepare for a period of continued market consolidation.
Looking ahead, traders should expect continued price swings across most commodity markets. Key factors to monitor include central bank policy announcements, particularly any indications of shifts in interest rates; weather forecasts in major production regions; and developments in global trade policies. The interplay of these elements will be critical in shaping market sentiment and price movements in the near term. Geopolitical tensions, especially in regions critical to commodity production and transport, add another layer of risk. Ongoing conflicts or trade restrictions can lead to sudden supply shocks, influencing prices across various commodity markets. Additionally, trade policies, particularly between major economies like the US and China, could impact global demand and supply chains, further contributing to price volatility.
The sugar market has been experiencing volatility due to fluctuating weather patterns in key producing regions and global demand shifts. Brazil, the world’s largest sugar producer, has seen a bumper crop due to favorable weather conditions, leading to a potential oversupply in the market. However, concerns about El Niño could disrupt production in other regions, potentially tightening supply later in the year. Traders should watch for price swings based on weather forecasts and changes in energy markets, as sugarcane is also a key feedstock for ethanol production
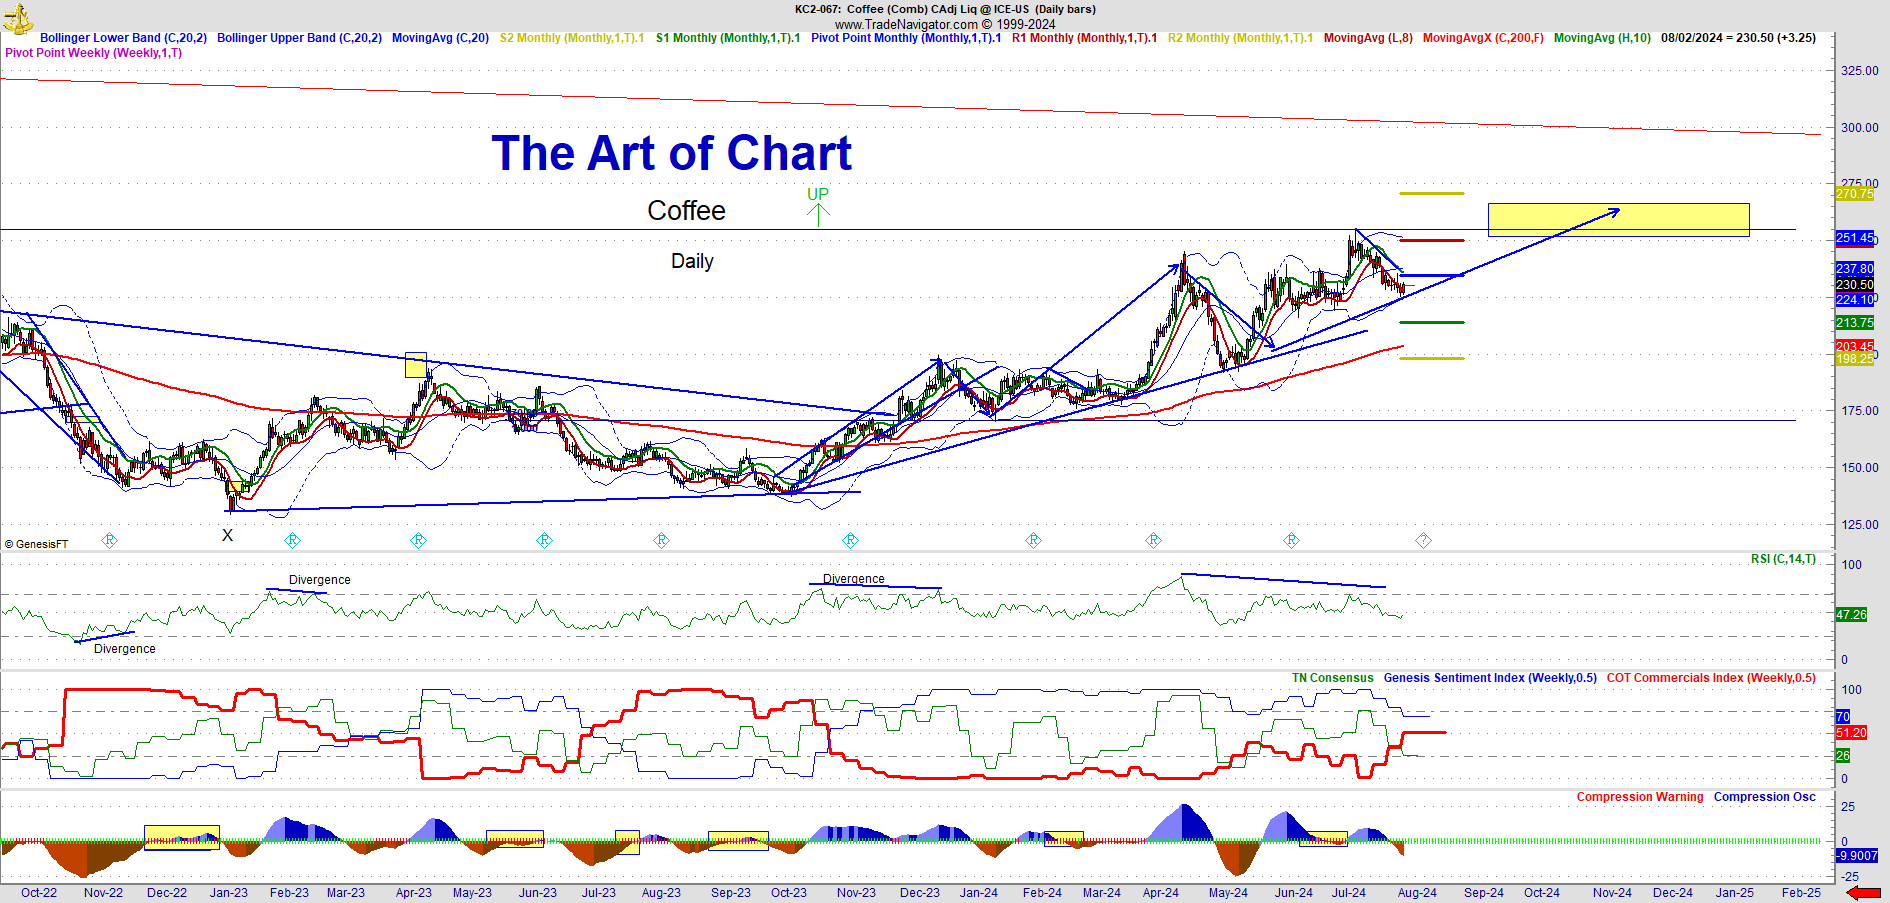
Coffee prices have been on a rollercoaster this year, largely due to unpredictable weather conditions in Brazil and Central America, the largest coffee producers. Frosts and droughts have impacted the Arabica coffee crops, leading to concerns about supply shortages. Additionally, increasing costs of fertilizers and labor are expected to maintain upward pressure on coffee prices. However, if weather conditions stabilize and production levels increase, prices could correct lower. For futures traders, keeping an eye on weather reports and export data from Brazil will be crucial in the coming months
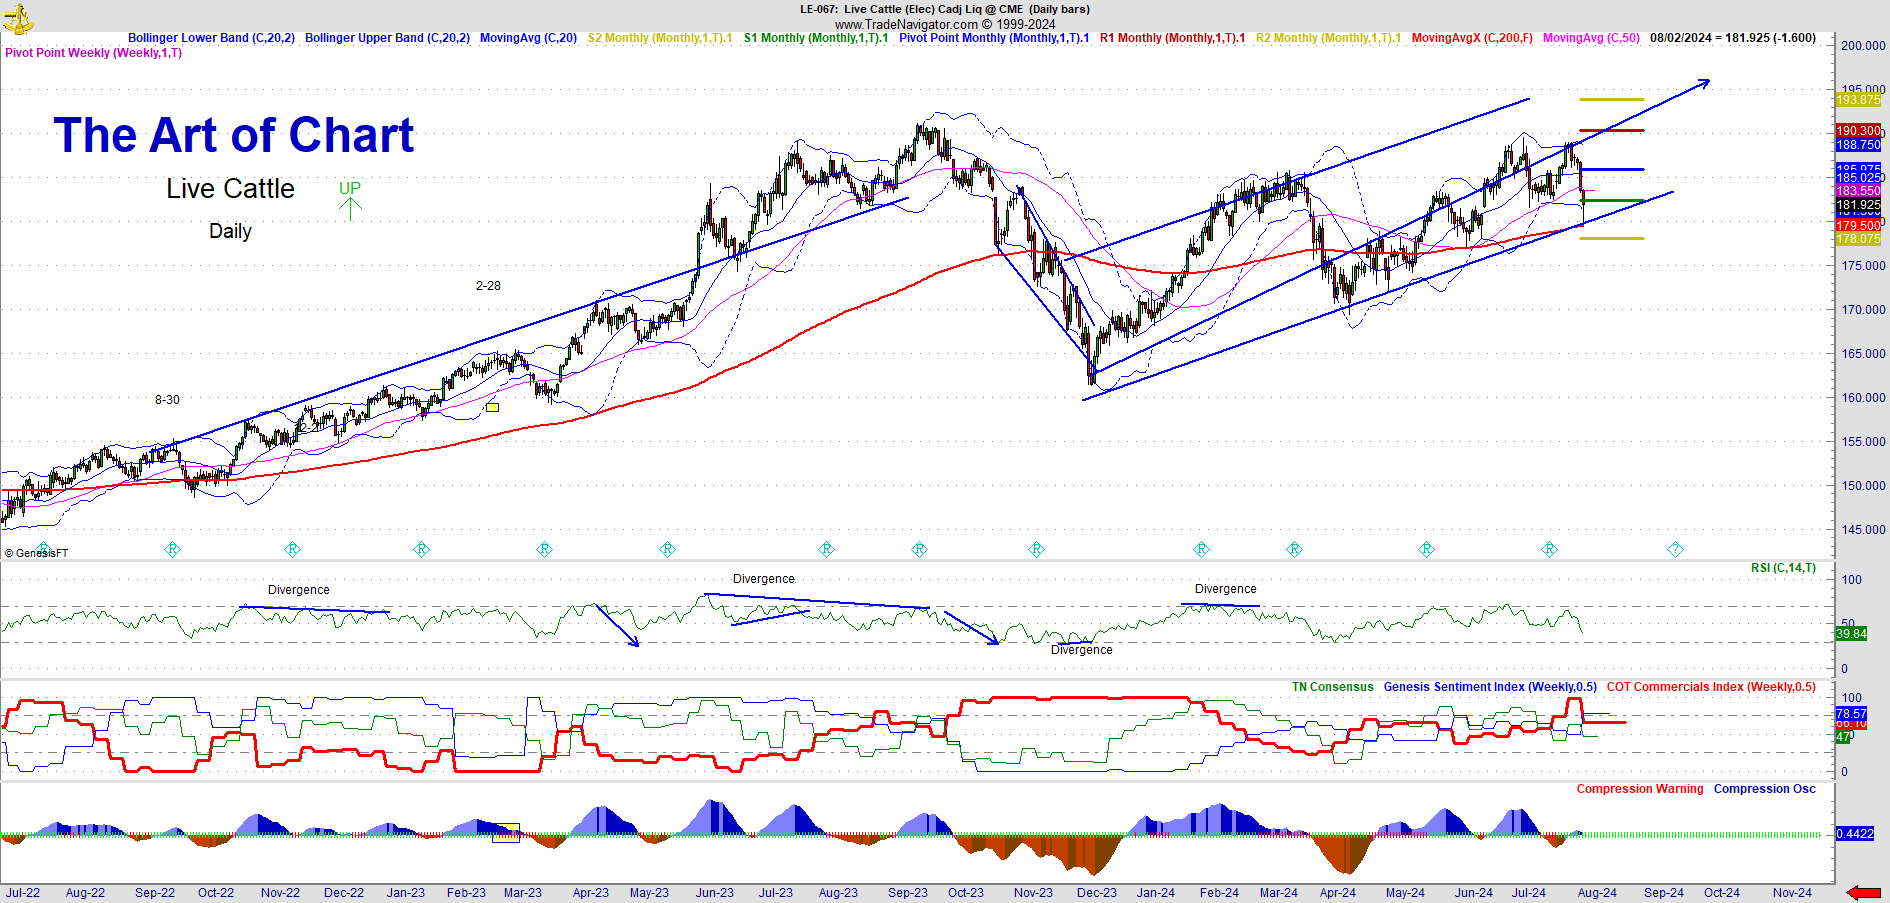
The live cattle market has been influenced by fluctuating feed costs, global meat demand, and drought conditions in major cattle-producing areas. Higher feed costs have pressured cattle prices, but strong global demand for beef has provided support. The USDA’s recent reports indicate tighter cattle supplies, which could drive prices higher as we move into the fall. Traders should monitor feed prices and export demand, especially from key markets like China, to gauge future price movements. Seasonal trends typically also play a significant role in cattle prices, with increased demand during holiday seasons
Gold has traditionally been a safe haven during times of economic uncertainty, and 2024 has been no exception. Recent volatility in global financial markets and concerns over inflation have driven investors towards gold, pushing prices higher. However, the potential for interest rate hikes by central banks like the Federal Reserve could dampen gold’s appeal as higher yields on bonds and other fixed-income assets make them more attractive. Traders should keep an eye on inflation data, central bank policies, and geopolitical developments that could impact market sentiment towards gold
All trades are posted on our Private Twitter Feed for subscribers and are in the track record posted below under Completed Trades. I am now trading 15 lots given the account balance and will increase as appropriate given changes in the account balance. See some of my completed trade videos below.
The Weekly Call can now be auto-traded on Striker.com. Just call Striker Securities and open an account of at least $25,000 and every trade I make here will be made for you automatically there. I am planning to use the same methodology and risk management approach with the auto-traded account at Striker that I have been using here. If you have a Daily Update or Trader Triple Play membership, there is no subscription fee for the auto-traded account at Striker. For more information, call Striker.com and speak with William at (800) 669-8838. For more information, you can also watch this video from our subscriber Q&A HERE. Trading futures contracts and commodity options involves substantial risk of loss, and may not be appropriate for all investors. Past performance is no guarantee of future results. Please see our Disclaimer for more information.
The trades below are discussed on the Daily Update: – Click Here for a FREE Trial
Sugar
7-1 – Wave C has made target, looking for a reversal pattern this week.
7-9 – Wave C has made target at $22 as discussed, now looking for a long setup and may need a minor lower low to enable pos D. Looking for higher highs.
7-16 – Looking for a retest of the low and a turn higher into he November Window an $28
7-23 – Breaking up and no change in forecast, still expecting $28 in Novi.
7-30 – No change in forecast, expecting expecting continuation higher into $28 target.
8-6 – Small flag forming, look for support at the lower band and higher into the $28 target.
8-13 Flag breaking up – follow through means we are on the way to $28 target
8-20 Support found at broken flag trend line, lean is long into $28 target.
8-27 Breaking up and looking for $28 as next target in November.
9-3 Continuation expected and higher highs into $28. support 24.30
9-10, 9-17, 9-24, 9/30 No change in forecast, continuation expected higher into $28
10-8 and 10-15 and 10-22 and 10-29 and 11-5 – Flag has broken up, follow thru coming to target $28-28.50.
11-12, 11-19, 11-25 – target made and a reversal into $22 can occur at any time.
12-3, 12-10- Sugar has broken down as expected, watch for the retest into the trend line and lower lows to $22
12-17, 12-24 Sugar has made target, looking for a reversal pattern and higher prices.
12-31, 1-7, 1-14 – Sugar is turning, no confirm yet but looking for more upside next year and higher into March.
1-28, 2-4, 2-11, 2-18, 2-25 – Sugar has confirmed the turn, looking good into the June high window into $30.
3/2, 3-10, 3-17. 3-24 – Sugar has printed a flag with an overthrow, looking for next rally into $30.
4-7, 4-14, 4-21, 4-28 – Flag has broken down and we may be forming a continuation pattern sideways, looking for $30.
5-19, 5-26 – No change to forecast we now have an overthrow, looking for a break up and confirmation with middle band.
6-9, 6-22, 7-6, 7-14, 7-21, 7-28 -Overthrow has converted the middle band and expecting upside into $28 next, look for continuation higher.

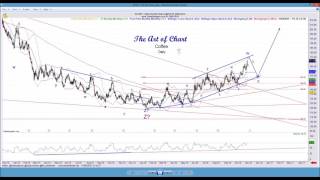
Coffee
7-1 – Coffee over throwing a support trend line and DX close to a turn here, giving this a little room.
7-9 – Coffee is over throwing a support trend line in a three down, lean is still long here and the pattern should break up. Columbia has 7 year low production, higher coming.
7-16 – Looking for a conversion of Monthly Pivot to see higher highs into the end of October. Production low should drive prices higher as demand is growing.
7-23 – Start of a rally Friday, could be the beginning of the move on Coffee higher into October.
7-30 – Lean is long and retesting support trend line. Bulls must perform this week, maintaining the forecast long into October.
8-6 – Follow thru last week is encouraging, look for the rally to continue this week and into 10-29.
8-13 – Support trend line holding up price, this week the bulls need to show up and rally above the previous high
8-20 – Looking for a rally back through the resistance trend line. Once seen we target the 220 area.
8-27 – Lean is long here and a few days of rally has not yet confirmed higher highs, convert the trend line and we open 220 area.
9-3 – Looking for the resistance trend line to break this week, USD likely to fall as well. Decision on this rally this week.
9-10 – Still waiting on the break up and the resistance trend line to break, Bollinger bands are extremely tight, a move is coming.
9-17, 9-24 – Break up may just be beginning, not far enough to confirm a turn, follow thru needed Monday.
9-30 – Low retest and a better long setup here, looking for a confirmed turn this week
10-8 – No reversal yet, turn in DX may support this this week. Convert the middle band and we have a reversal.
10-15 – Start of a rally, waiting for the confirm when we convert the middle band. Looks like the turn may be in.
10-22 and 10-29 – Turn is in and watch for a middle band retest and higher highs expected to 200
11-5 – Retest is done and higher highs now expected into the declining resistance trend line.
11-12, 11-19, 11-25 – More upside expected, still targeting $200
12-3, 12-10, 12-17, 12-24 – Close to target, likely we see a small retest and higher to make target by year end
12-31, 1-7, 1-14 – Retrace is in progress and looking for 175-76 then new higher into 225
1-28, 2-4, 2-11, 2-18, 2-25 – Made target as expected and has broken the flag, looking for new highs into 225-240.
3-2 – Another flag is printing in Coffee, this should break higher this week.
3-10, 3-17, 3-24 – Flag has broken higher and looking for more upside. Continuation pattern looks complete here.
4-7 – Break up as expected and 230-250 is next target.
4-14, 4-21, 4-28 – TARGET MADE – retest into 205 and higher highs into the trend line at 275 is next.
5-19, 5-26, 6-22, 7-6 – No change in forecast – retest is done, looking for 260-65 next and middle band should confirm this week.
7-14, 7-21, 7-28 – Approaching target and should be seen by next week. 260 is next.
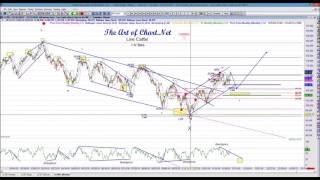
Live Cattle
7-1 – Like Cattle over throwing a trend line and a double bottom coming, overbought and looking for a move lower this week.
7-9 – Live Cattle head count shortage still a problem and higher highs still expected into January. Retest first to make room on RSI then higher highs.
7-16 – Higher high, neg D, retest of support required here and higher highs into the end of the year
7-23 – Possible turn, no confirm yet, needs to convert the trend line, lower lows coming.
7-30 – Broken trend line and more retest coming, convert middle band look for $174 next then higher highs.
8-6 – flag forming here and lower low likely. FC and LE are still stretched and higher is expected into January, we need more retest first.
8-13 – Flag breaking down and looking for 178 support then the turn higher.
8-20 – First three down complete, lean is long but likely we see bounce and another three down into 175 or so.
8-27 – One more legg lower as the FC chart needs a lower low. Once seen, then look long for new highs by year end.
9-3 – Still needs a lower low and a turn may be in, 176 target expected and may see 175.
9-10 – Needs a serious retrace and so does Feeder Cattle. Looking for a break lower then 176.
9-17, 9-24, 9-30 – Breaking up so watch for a retest into Monthly Pivot minimum and if we convert then we see full retest into 176 then higher. Higher highs into year end expected.
10-8 – Retest may be completed here or we see resistance at 189 then lower to 184. Break the low Monday/Tuesday we see 184. Higher highs into year end expected.
10-15 – Wave C lower to complete the patterns, then look for the next major rally.
10-22 – Wave C has started, watch for 182 next
10-29 and 11-5 – Made target and looking for the last legg higher into the end of this year, 195 target.
11-12, 11-19, 11-25, 12-3 – lower low here is a buying opportunity, looking for the next rally to new highs into the new year
12-17, 24, 31, 1-7, 1-14 – Broken trend like, this is a candidate turn, convert 174 and look for higher highs into 195 into June.
1-28, 2-4, 2-11, 2-18, 2-25 – Turn is confirmed and a slight bearish over throw on the channel, look for support at 172-73 then higher into the 6-1 window.
3-2, 3-10, 3-17, 3-24 – Approaching a 5th wave high and a larger pull back into 183 then higher to target expected.
4-7, 4-14 – Larger than expected pull back – lean is still long here, FC showing a 50% back so looking this week for a turn.
4-21, 4-28 – Turn may be in and next target to the upside is 190, needs to convert middle band to confirm.
5-19, 5-26, 6-22, 7-6, 7-14, 7-21, 7-28 – Turn is confirmed and looking for 195 next, likely we see a band ride next into mid June.
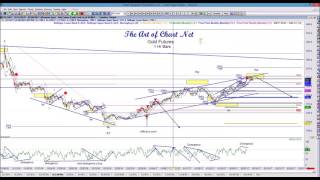
Gold
7-1 – Gold just beginning to break up, looking for middle band to convert on a daily basis to confirm the long into 2150.
7-9 – IHS and looking for a rally in metals with the drop in DX this week. Monthly pivot should break up, looking for new highs into year end.
7-16 – Gold breaking up and DX drop has signaled a turn. Looking for higher highs into the end of this year into 2150.
7-23 – Gold breaking up and DX drop did help, lean is long and DX retrace needs to finish into 101 then look for next move higher in Gold.
7-30 – DX rally last week off the FOMC meeting and looking for a DX turn and also a Gold turn. Looking long here into 2150.
8-6 – Flag formed here, and buy signals fixing, looking long into 2150.
8-13 – Flag here is full developed, this should break up this week. USD will need to cooperate. 2150 target.
8-20 – Flag well developed here, waiting on the break up. Gold is extended and higher highs into end of September expected.
8-27 – Nice rally to start, DX has not yet turned so retest and higher expected. End of Sept. window still holding strong.
9-3 – Lean is long and a strong showing nu GC in the face of a DX rally. Looking for 2050 by end of September.
9-10 – Higher low and DX needs to cooperate and turn to see higher highs in Gold. Still looking for 2050 into end of September.
9-17, 9-24 – Breaking up – need to see continuation Monday to confirm this turn and DX needs to reverse.
9-30 – Gold has broken down and nice flag printing. DX is very expected and a reversal back above 70 confirms the turn and look for 2050 next
10-8 – USD has a sell signal fixed so watch for the confirmed turn above 1870 this week.
10-15 – As mentioned last week, DX sell signal fixed and decline has started, GC rally playing out as expected. 2050 next target.
10-22 – On the way to target and at the top of a 5th wave, retest expected this week then higher highs.
10-29 – Bigger retest into 50-60 then higher into the 2050 target by mid-November.
11-5 – Retest expected into 70 then look for higher highs into 2050, will see 2150 into Feb next year.
11-12 – Retest made target and then some, lean is still long and looking for a turn this week.
11-19. 11-25 – Turn is confirmed, looking for new highs into 2050 next
12-3 – We have made target, 2010 retest target and higher highs to 2150 next.
12-17, 24, 31, 1-7, 1-14 – Retest is done, and higher into 2150 is next, look for DX to continue to drop.
1-28, 2-4, 2-11, 2-18, 2-25 – DX is about to turn and looking for a conversion of 40 this week for a move higher into 2150 then by year end to 2400.
3-2, 3-10, 3-17 – Nice squeeze and the turn is in and 2150 is expected next, then 2250
3-24, 3-31 – Target 2250 made, support retest into as much as 2150 then look for 2400 next.
4-7 – Lean is long and currently oversold, looking for a pull back and then 2400.
4-14, 4-21, 4-28 – TARGET MADE at 2400 and retest into 2330 and higher highs expected into 2700
5-19, 5-26, 6-22, 7-6 -Retest done and next short term target is 2475, then look higher for 2700, DX should continue to fall.
7-14, 7-21, 7-28 – Breaking up and DX falling as predicted, looking for follow thru into 2475 next.

Come see what we are trading – Try our 30 day FREE trial – Click Here
COMPLETED TRADES
Track Record of Completed Trades
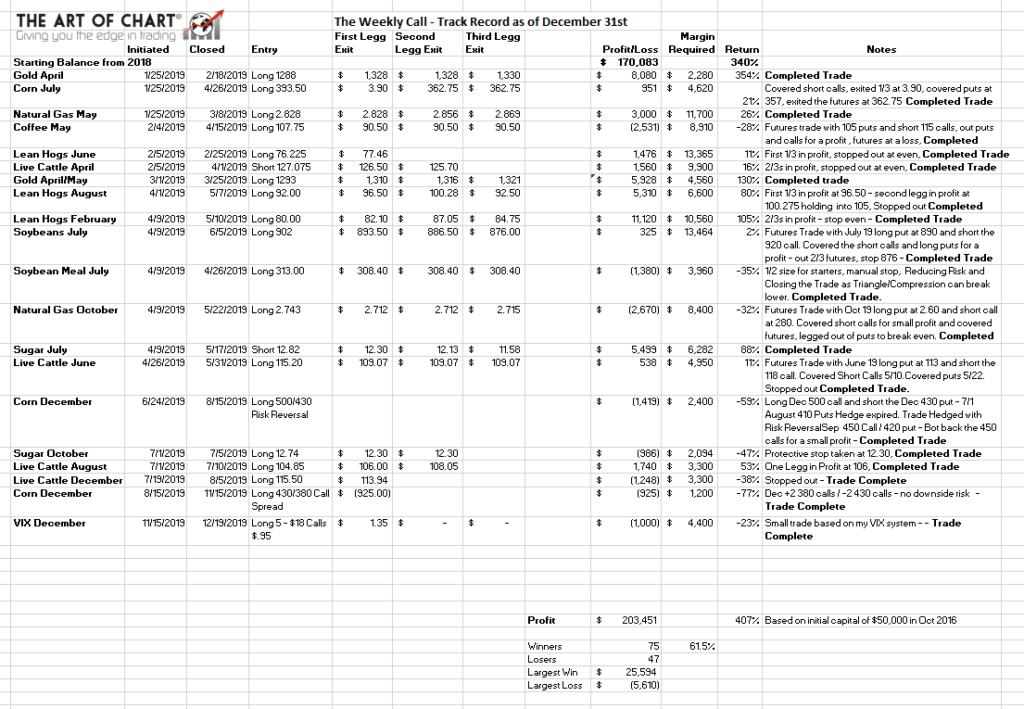
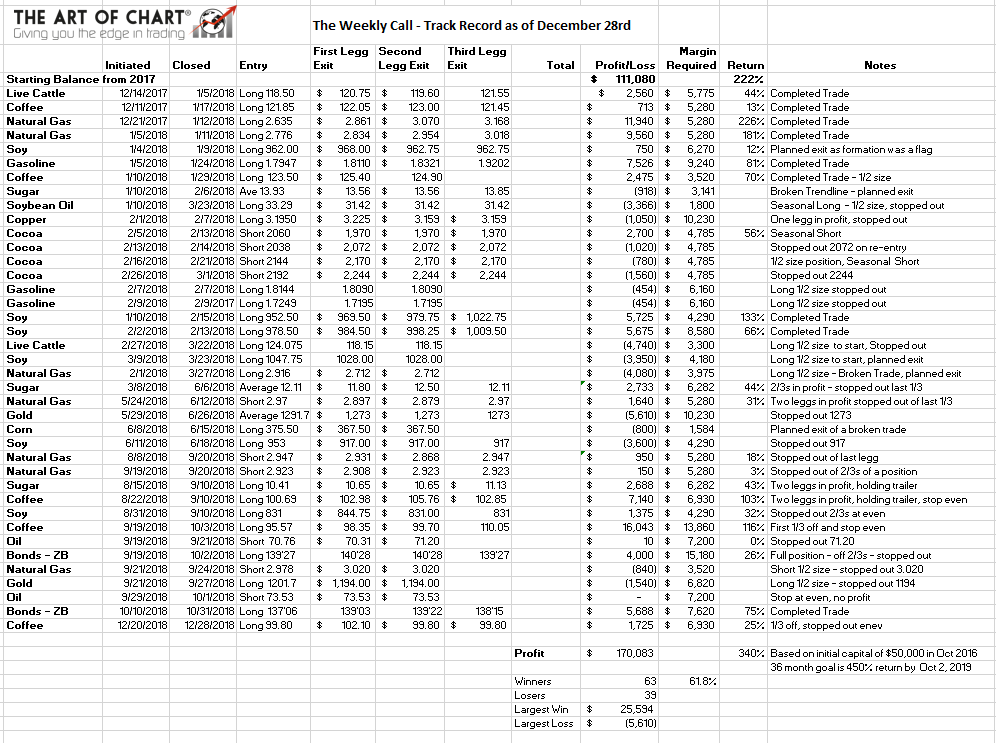
The purpose of this blog is to demonstrate how to swing trade futures using our methodology to select high-quality setups and manage the trade with our risk management approach. This track record is based on entries and exits as posted in this blog. I am currently using 15 lots for the Striker trades which is based on this account being over $375,000. Each lot for auto trading at Striker requires $25,000 per lot. See the videos below for more information.

Track Record January 2022 thru December 2022 Click Here.
Track Record January 2021 thru December 2021 Click Here.
Track Record January 2020 thru December 2020 Click Here.
Track Record January 2019 thru December 2019 Click Here.
Track Record January 2018 thru December 2018 Click Here.
Track Record October 2016 – December 2017 Click Here.
*** Trading futures contracts and futures options involves substantial risk of loss, and may not be appropriate for all investors. By reading this web site, you acknowledge and accept that all trading decisions are your sole responsibility. Trading strategies referenced on this web site and associated documents and emails are only suggestions, no representation is being made that they will achieve profits or losses. Past performance is no guarantee of future results.. See our disclaimer here.
Completed trade in Cattle as of November 28th
We expect subscribers to have captured 60% of the swing in live cattle which is over $14,500 in profit using a margin of only $5,115. A great example of using leverage in futures.
Completed Trade in Coffee as of December 12th
The total swing was $37.00 and we expect subscribers to have captured 60% of a wing or $22 in coffee for a profit of over $25,500 using a margin of $8,850. A great example of using leverage in futures. See the video below for the review of the trade.
Completed Trade in Natural Gas as of January 2nd
We were stopped out of out last 1/3 position as weather-related news created a gap down on January 2nd and a possible flat with support at 3.196. This concludes our trade with natural gas; we exit with 550 ticks on 2/3s of a position with $8,500 in profit.
Completed Trade in Coffee as of January 19th
We exited the coffee trade on January 19th with $17 or over $15,000 in profit using a margin of $8,850. A great example of using leverage in futures.
Completed Trade in Gold as of February 8th
We exited the gold trade on February 8th with over $14,000 in profit. We entered on January 3rd and held the trade into the high window. We will re-enter gold in a few weeks after a backtest.
 04th Aug 2024
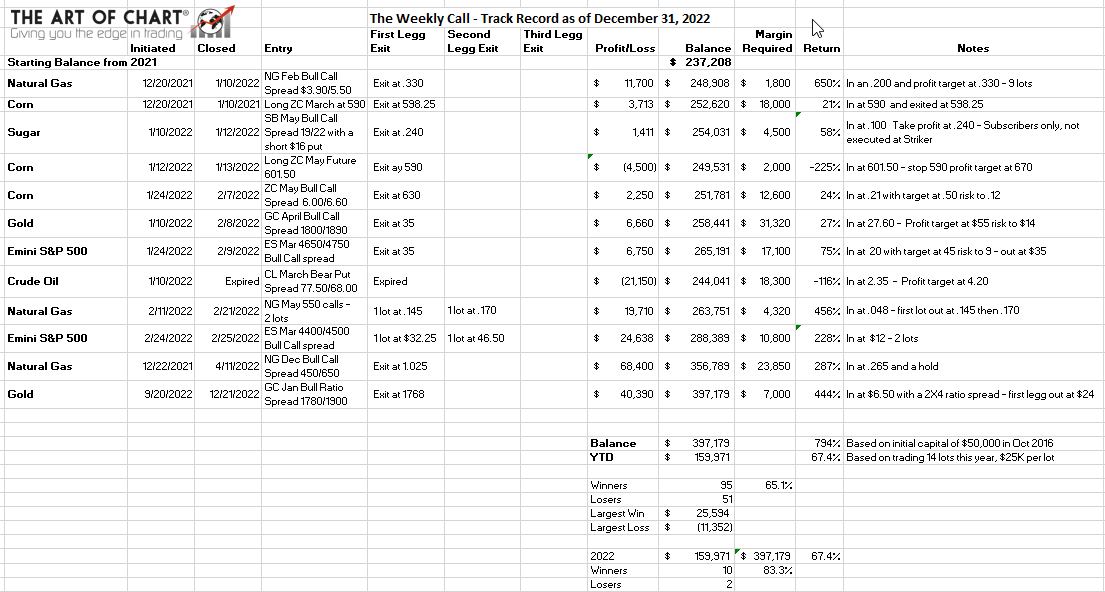