The Options Trading and Investing service provides perspective on high quality setups and option trading strategies for the coming week. We carefully select these setups due to their quality and profit potential and we report back on results. In the weekend free webinar I review current portfolio performance and I also discuss techniques that I utilize to help reduce risk and, in some instances, lock in profits from previous trades.
Please refer to our education video HERE for more information in the option strategies used in this post.
The entries and cost basis of new positions will appear on our private twitter feed during the coming week.
Below is the list of all open and closed positions in the options portfolio. The total profit is $601. The best position percentage wise is the short XRT position with a 41.9% profit. The worst position $ wise is EEM with $737 loss.
Below is the list of the closed positions from previous trades. If you have been following along with our RUT positions you will see that I closed 2 positions last week. In actuality, those trades were rolling strikes to change the shape of the risk profile and to add to the downside bias of the position. That will allow for more profits to the downside if RUT moves lower in price.
All new trades will be posted on the subscriber private Twitter feed.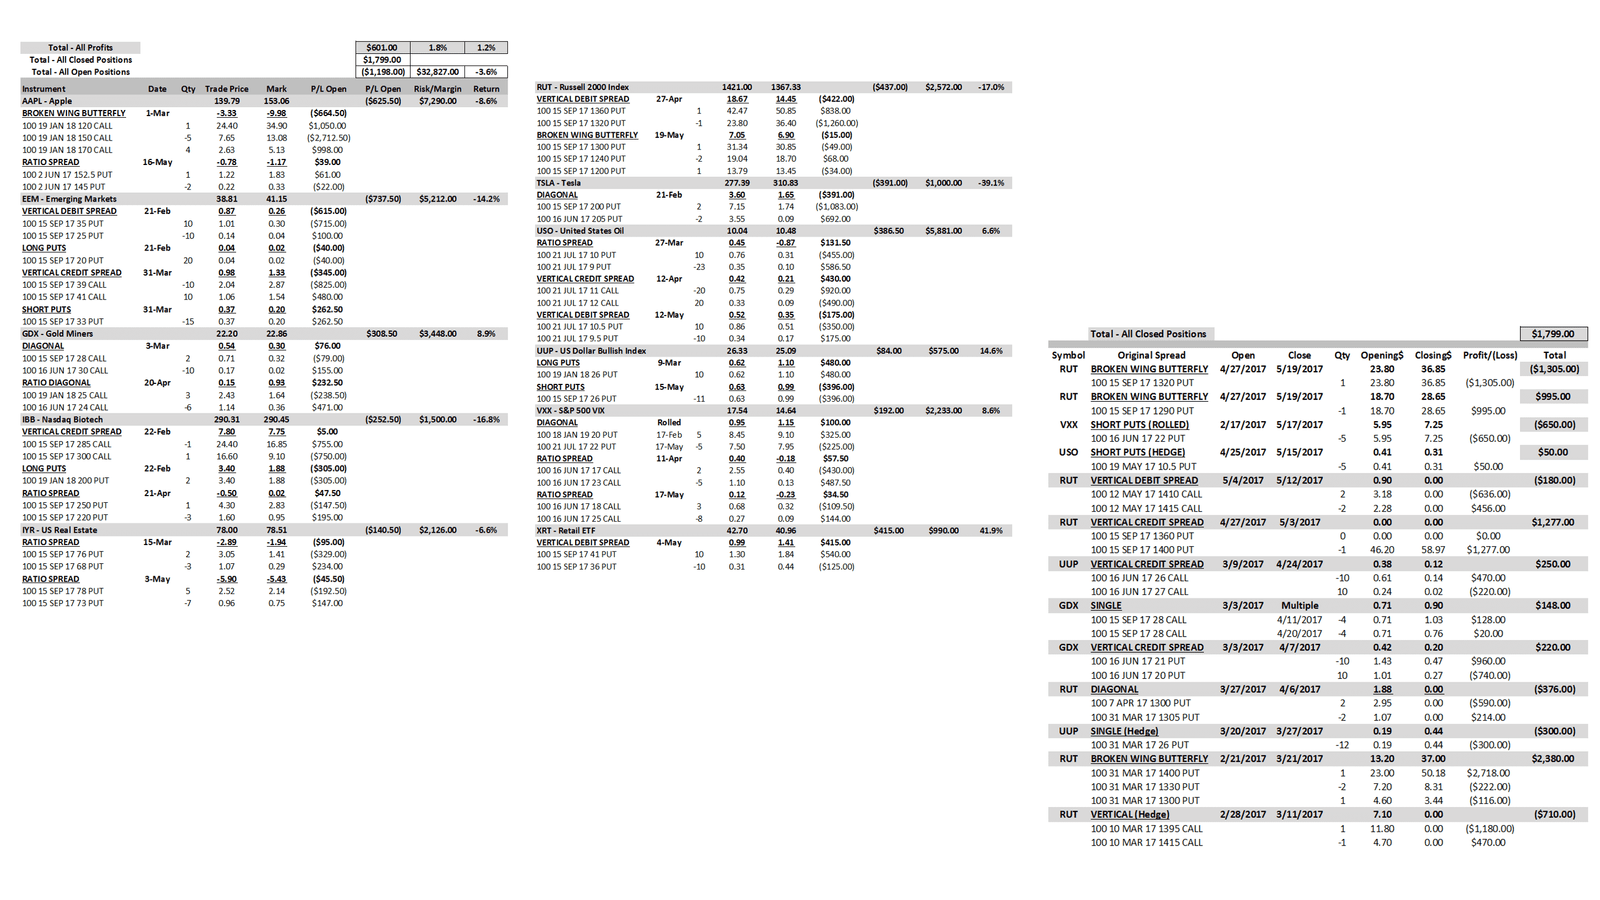
Below is the current position in EEM. As mentioned, this is the portfolio’s worst performing position. You won’t see me trying to skip over the worst performing positions in this portfolio because there is great educational value in learning how to manage the under performers. In the following slides you will see how I manage the best performer. The point of today’s webinar is that all positions should be managed (but not over-managed) to maximize profits and minimize losses. All positions must be managed going forward. Nothing that happened in the past affects the way I manage for the future. Here, I am starting with the base position where I am at a $737 loss. Going forward, I need a 4% move lower by Sep15 expiry to break even on the position. That fits well within Stan’s projected move so I am good with that. However, do I need peak profitability to line up with the $33 strike? That is what I thought when I initiated the position on Feb21 but 3 months have passed without the larger move down beginning. I will get Stan’s updated targets but I suspect I will make adjustments to move the peak up to $35-$36 price level. I can generate a credit to make that adjustment which will give the position a better break even price and reduce overall risk. Watch the Twitter feed this week for adjustments. 
Below is the current position in XRT. It is a $5 wide Put Vertical Debit Spread. The most you can make on a vertical debit spread is the width of the spread, in this case $5 (41-36), less what you paid to buy the spread, in this case $.99. I bought a 10-lot position so my cost is $990 and the maximum profit at expiry would be $4,010. The current open profit on the position is $415. Vertical debit spreads are always less expensive when they are purchased with out of the money (OTM) options so the reward/risk is higher. They are also a lower probability position but I am not a probability trader in this instance. The reason why is the Art of Chart option portfolio relies on the charting analysis of Stan and Jack to decide entry points. I initiated this position on May 4th because Stan was projecting XRT to move lower imminently. In the last 2 weeks, XRT has dropped from 42.70 to 40.96, a 4% move lower. Because I could place the lower probability position with the higher risk reward, the position’s return of 42% is 10 times the move of 4% on XRT. That is the power of combining option leverage with good chart analysis. Now, what if Stan thought XRT was heading higher here? To be clear, Stan may not be projecting a bounce here, the next slides are for learning techniques of adjusting positions if that was the case.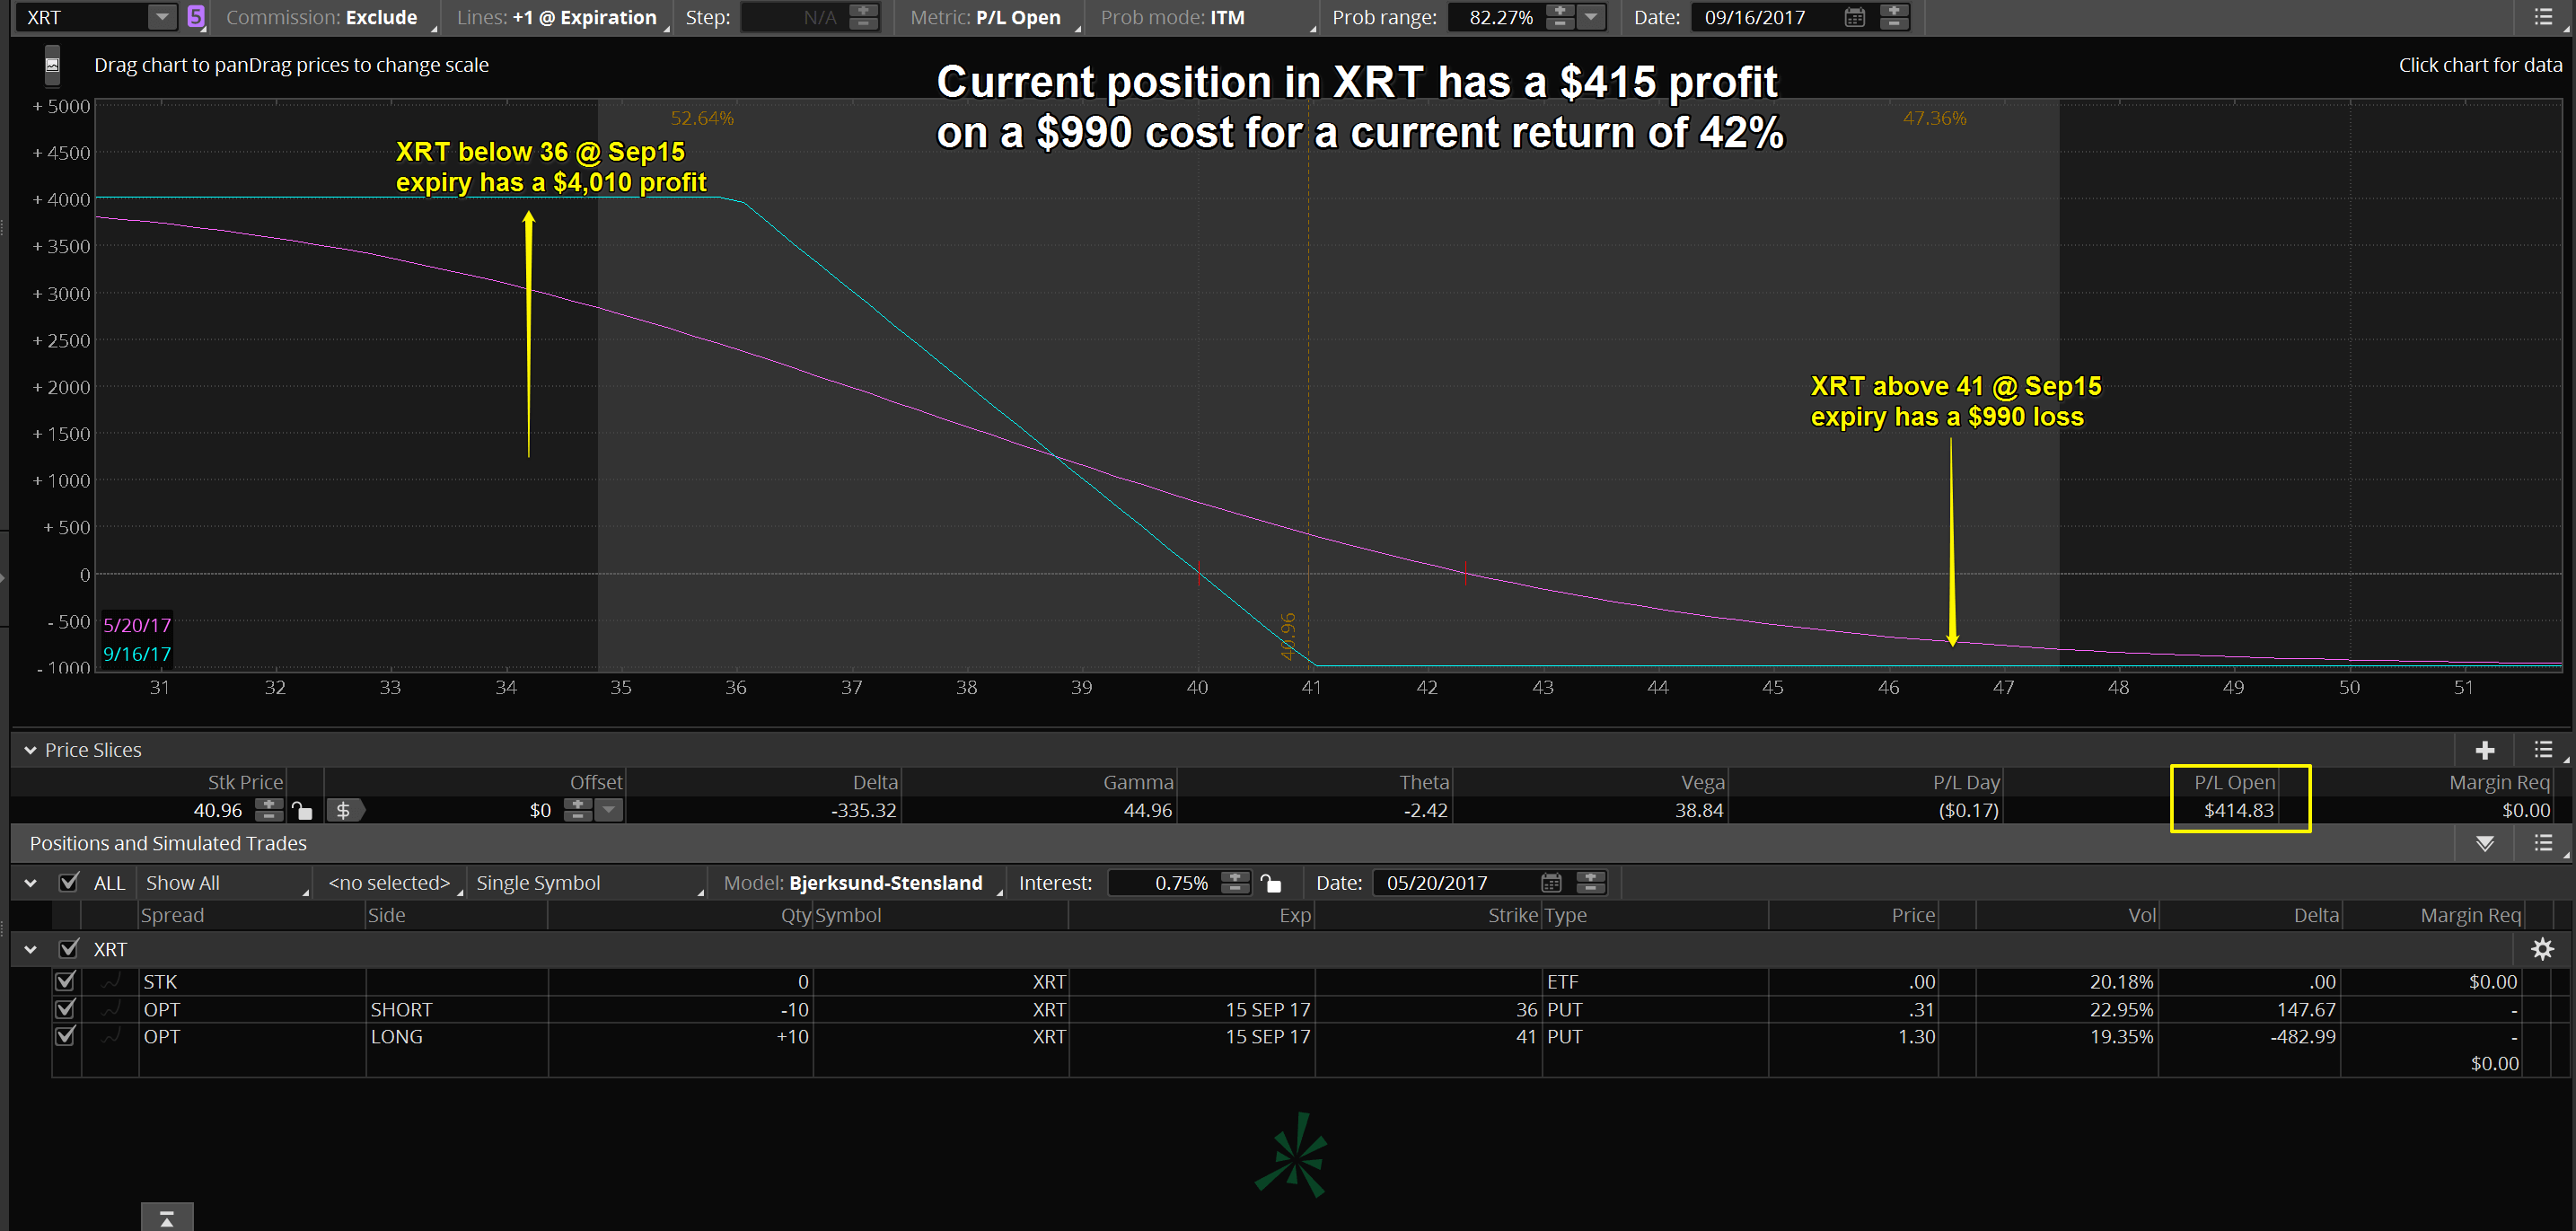
Below are several slides showing various potential adjustments that could be made to reduce cost basis and even locking in a profit while maintaining the potential for an even larger profit. The 2 slides directly below show what the risk profile would look like if I ‘rolled’ the long Put down by $1 (left) and by $2 (right)

Below shows $3 and $4 rolls lower in the long Put


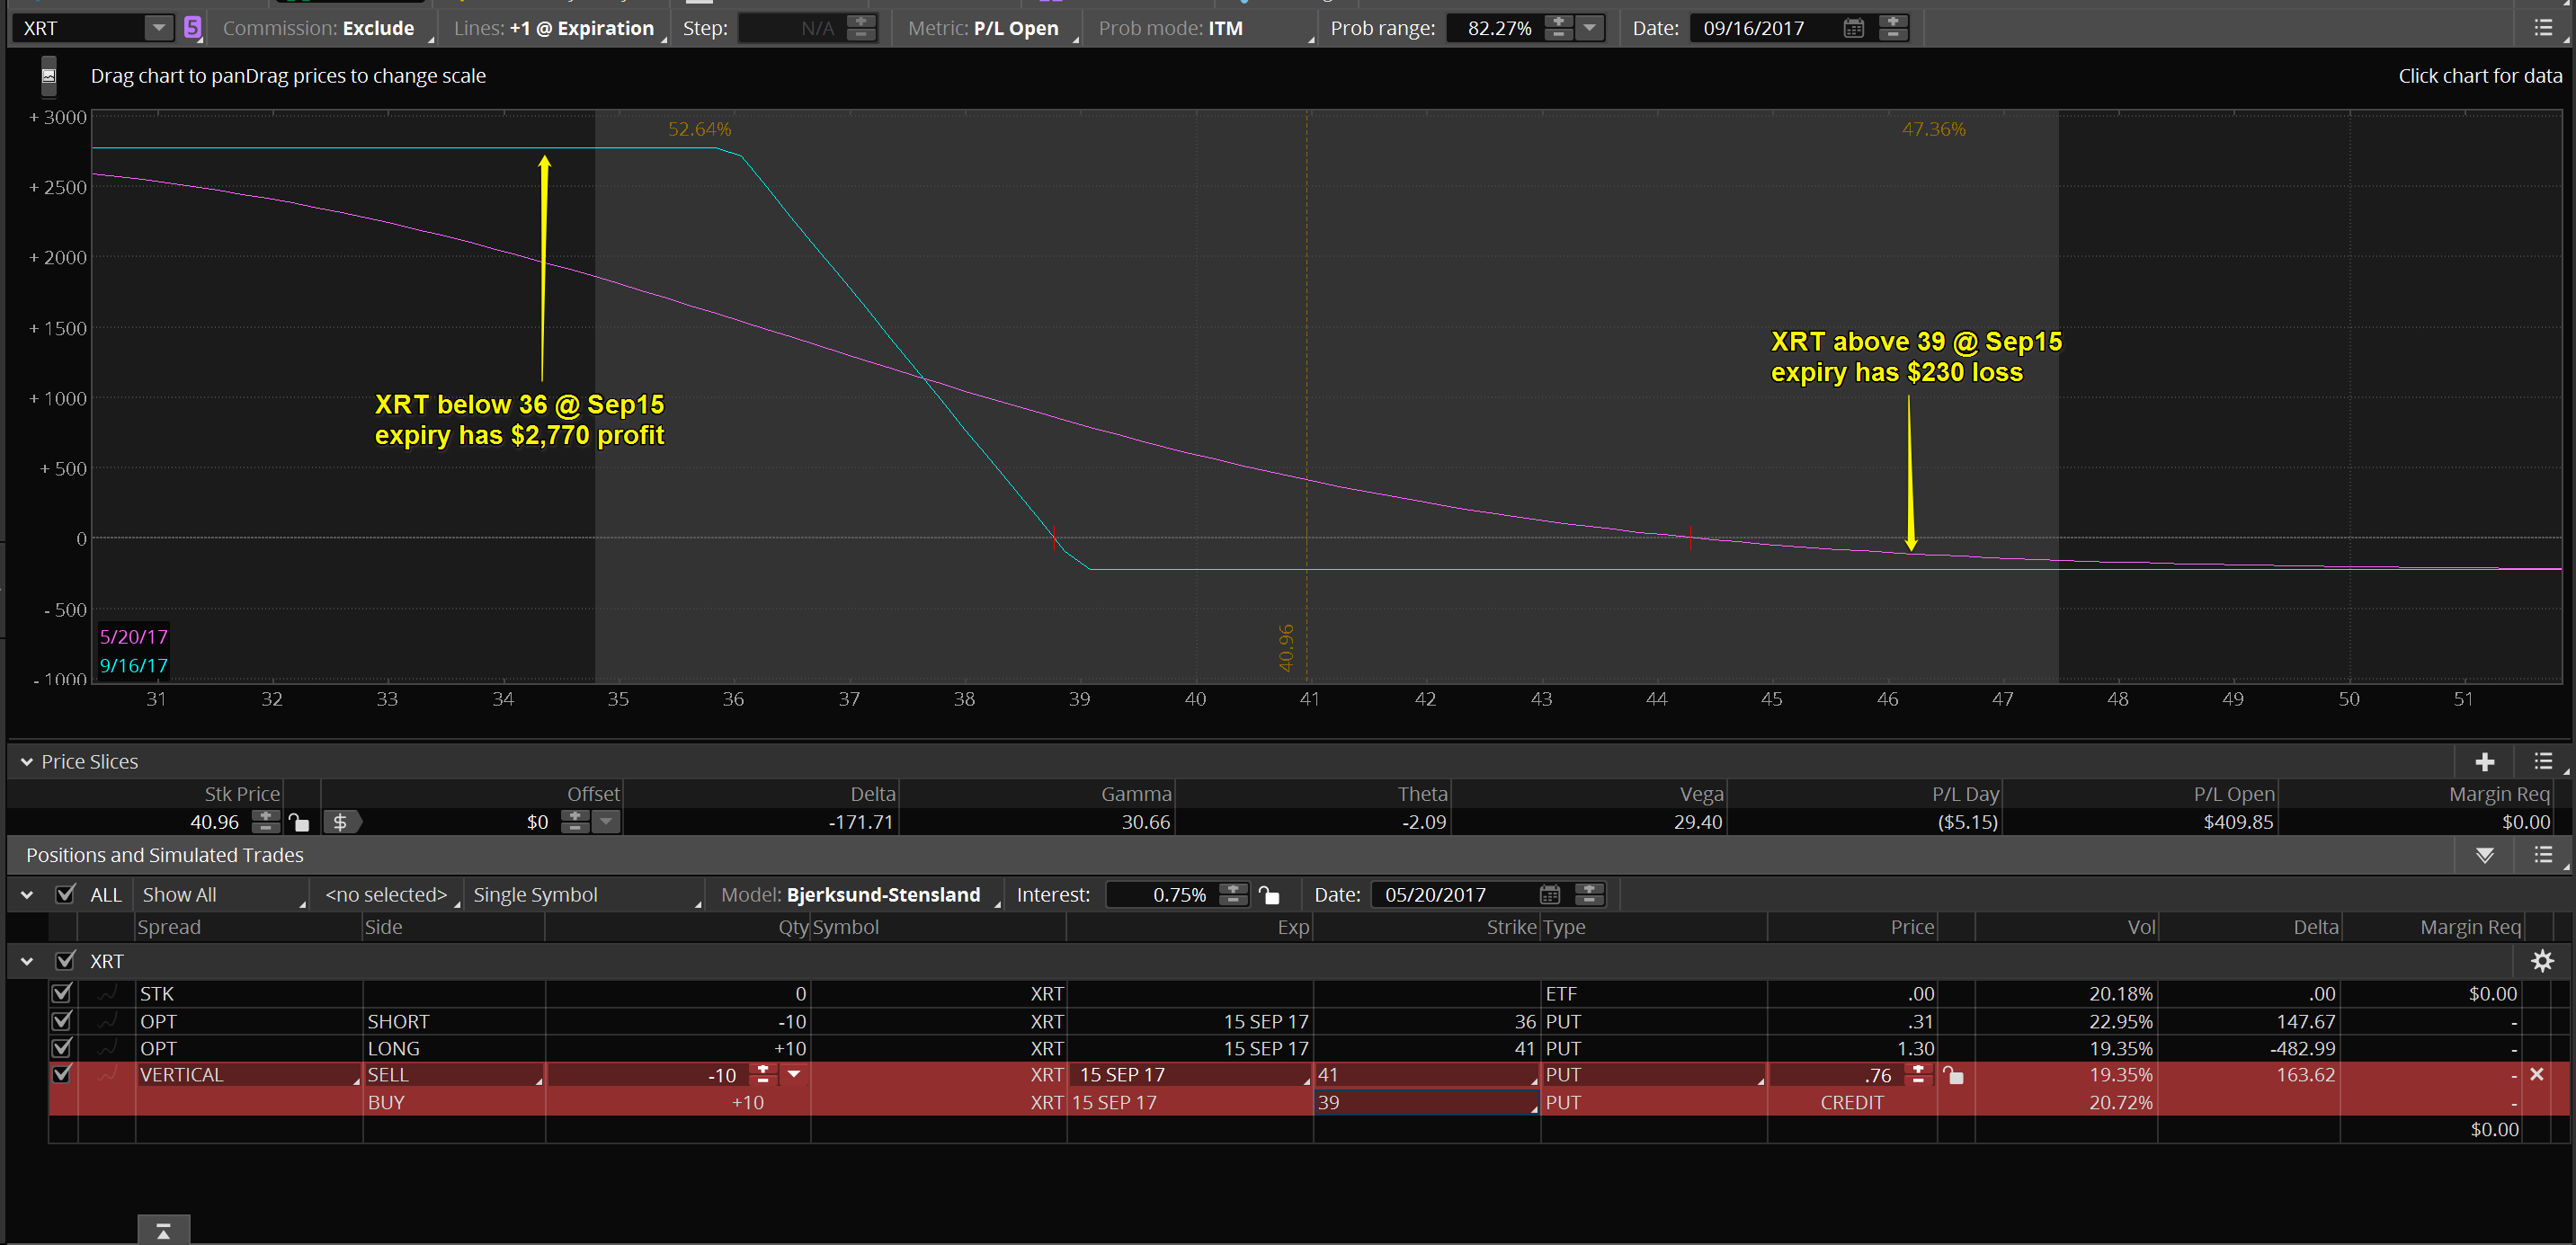
Finally, since this is an educational exercise, you should understand that you can attack your cost basis from both sides of the position! Below I consider rolling the 41 put down to 39 to knock $.76 off of my cost basis and I also consider selling a $2 wide Put Vertical Credit Spread for a $.21 credit. Combining the 2 potential trades would reduce my cost basis from $.99 to $.02. You can see the potential profits below. Experienced option traders will recognize the structure below (left) as a Broken Wing Butterfly (BWB) that I legged into. The reward/risk could potentially run as high as 149/1.
Below (right) rolling the 41 put down to the 38 strike and selling the $2 wide put credit spread creates a standard Butterfly Spread. If I were to do this I would lock in a $260 profit with the possibility of making up to a $2,260 profit.


Now, you could look at the standard Butterfly spread on the last slide (above right) and rightfully say that if I made that adjustment, I would most likely just end up with the minimum $260 profit. XRT would have to be between 34 and 38 to have a chance of making more than that amount. That is a reasonably narrow price range. On the other hand, if you have a option portfolio with many positions that you adjust over time, it is possible that you could have multiple positions that look similar to this in other underlying instruments. The more of these types of position that are spread through out your portfolio, the more likely some of them will end up in that very profitable area. You could also have multiple no-risk positions in your portfolio. It is difficult, if not impossible, to build a solid options portfolio by trying to hit a home run on every pitch (baseball metaphor). Once I have established a position that has turned profitable, I will look for opportunities to reduce my cost basis. I do that in conjunction with Stan and Jack’s chart analysis but I still have to take responsibility for managing portfolio risk and that is best accomplished by reducing risk when it is practical. Remember that reducing risk doesn’t mean you have to close your positions early. That was the point of today’s exercise. Understand how you can reduce or eliminate risk and still retain potential additional profits. You may be surprised at how successful you can become.
Currently we have been offering a soon to expire free trial of the option service to all ArtofChart.net subscribers. Option trades are tweeted out through the private subscriber feed such as the XRT position as shown below. Stan and Jack are also offering a free 30-day trial to the charting service and it is well worth a try!
 21st May 2017