The Options Trading and Investing service provides perspective on high quality setups and option trading strategies. We carefully select these setups due to their quality and profit potential and we report back on results. In the weekend free webinar I review current portfolio performance and I also discuss techniques that I utilize to help reduce risk and, in some instances, lock in profits from previous trades. This week I discuss a potential adjustment to the TLT position and how to add a hedge to an existing position to adjust Deltas prior to an earnings announcement. Finally, I update the Apple stock vs. Apple option ‘competition’ to see which strategy is performing best.
Please refer to our education video HERE for more information in the option strategies used in this post.
The entries and cost basis of new positions will appear on our private twitter feed during the coming week.
Below is the breakdown of all open and recently closed option positions. 
This is the slide from last week’s webinar where I established a bearish position in TLT:
Below is the new position in TLT. It is short 122 Deltas. Based solely on probabilities, this position has a 50/50 chance of being profitable at expiration. That is because the current price of TLT also happens to be the break even price of the position. The worst possible outcome is a $859 loss. The best outcome is a $1,641 profit which is almost a 200% reward/risk ratio. Probabilities aside, the position is based on Stan’s projection of a move lower into the Fall.
Stan mentioned there might be some more movement to the upside this past week prior to the later move down. That was the primary count but there is an alt count where TLT just continues higher. There was upside price movement that went beyond where I wanted to hold short Deltas in the October position so I made an adjustment to pivot to long Deltas.
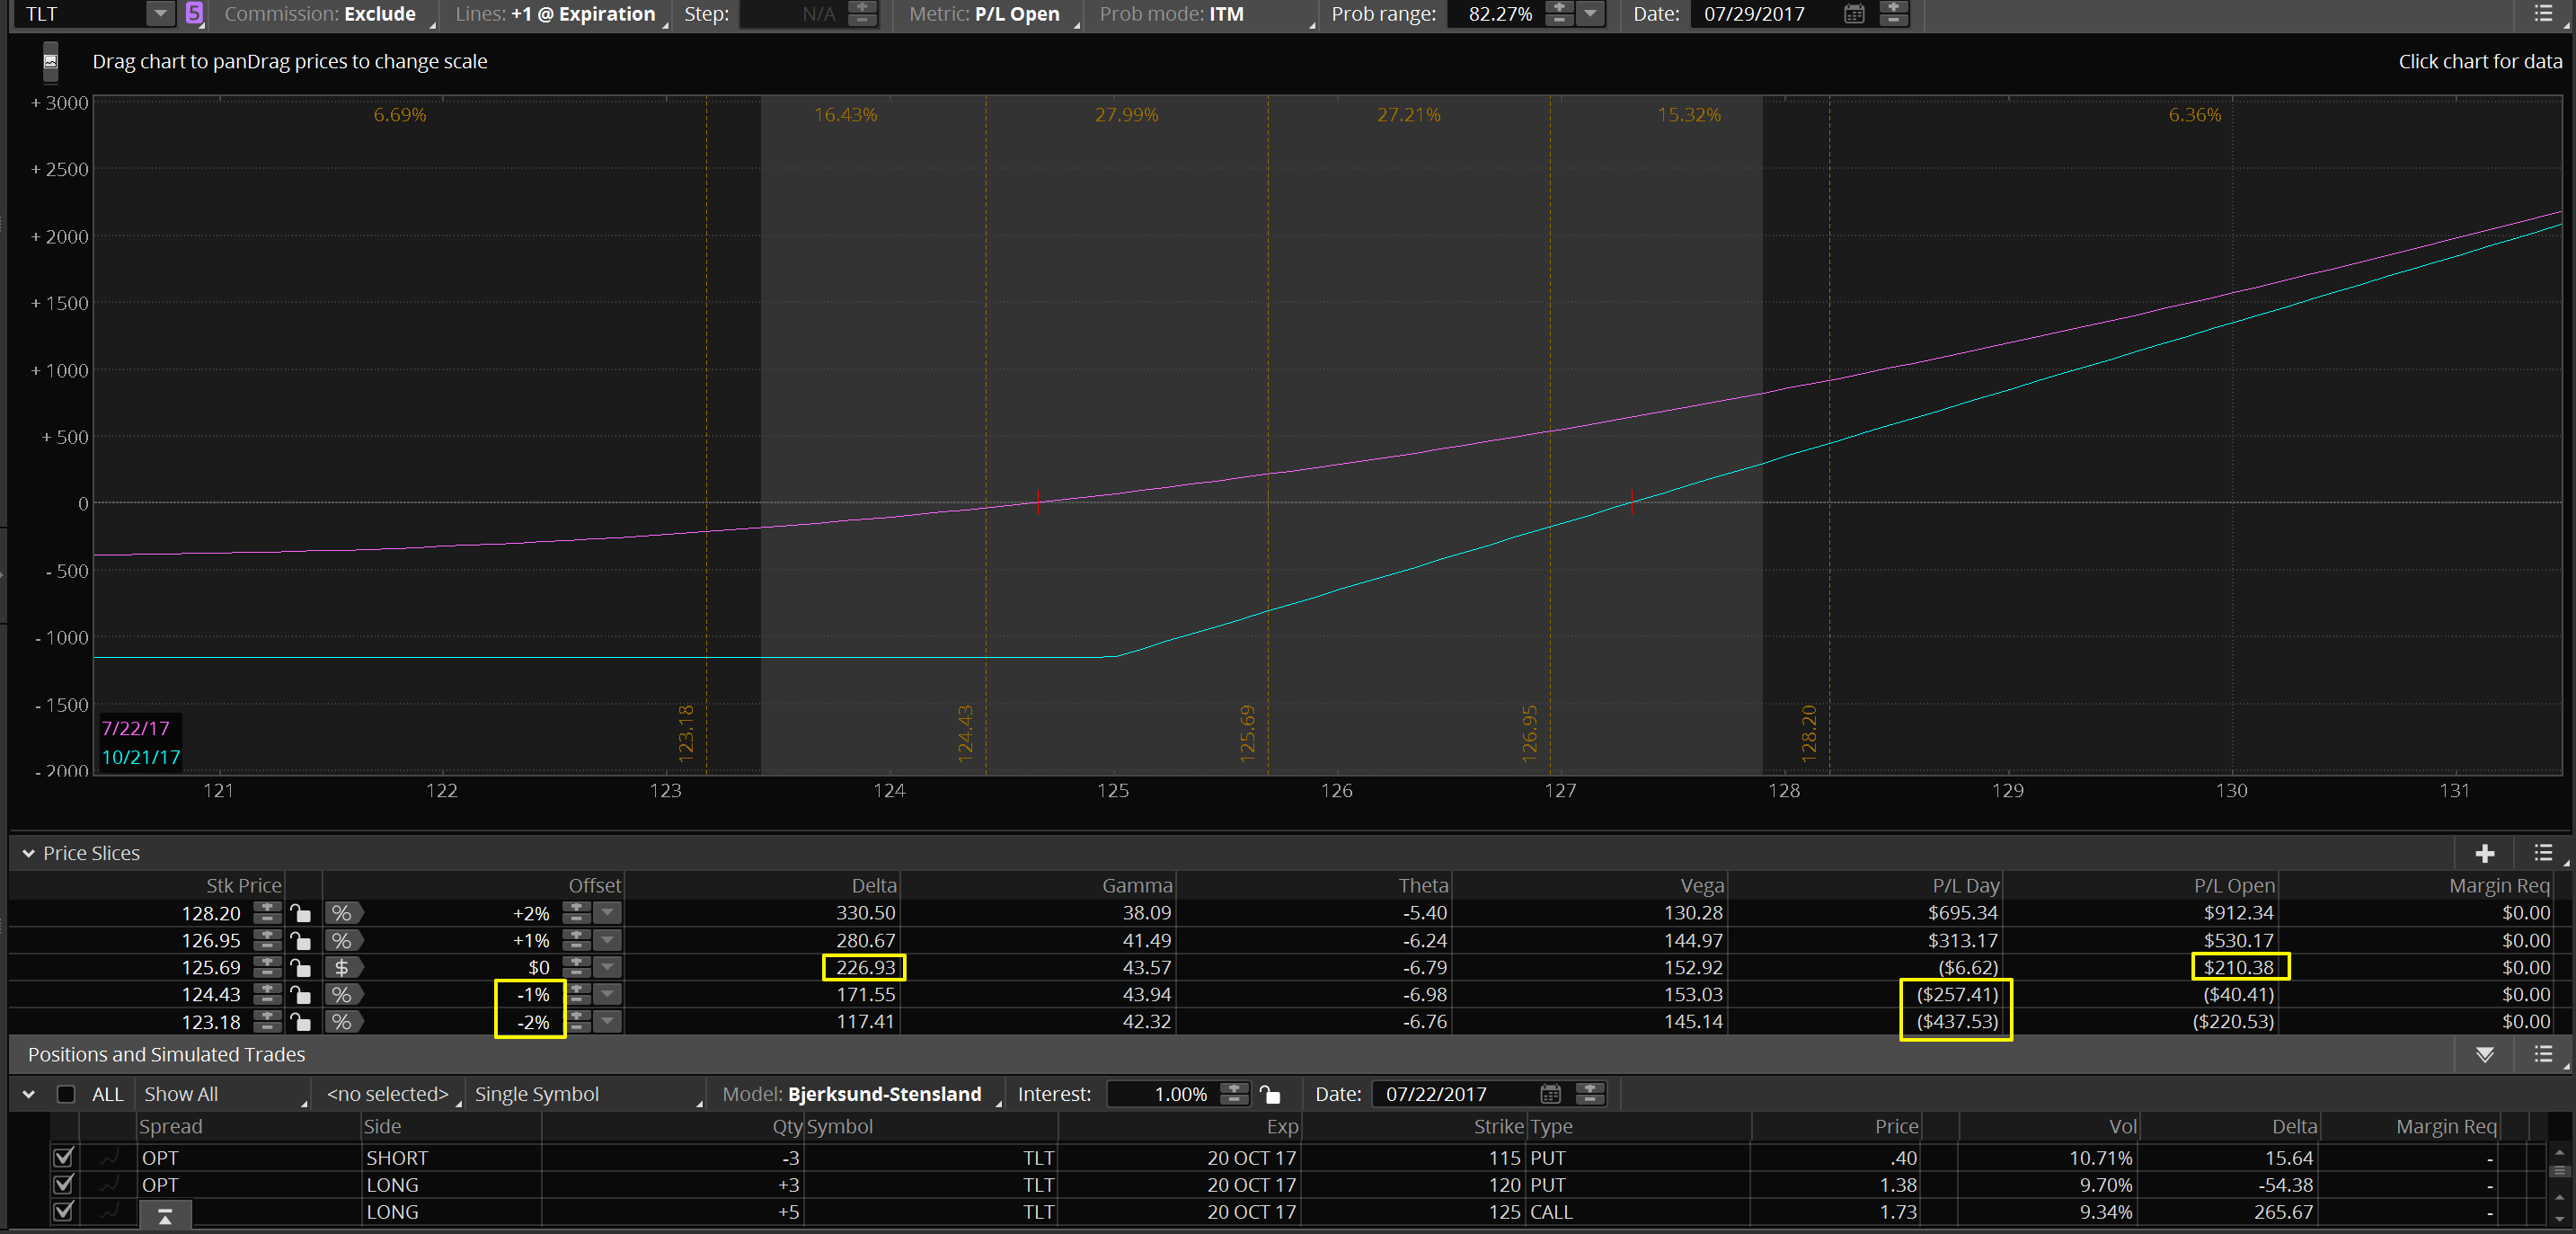
After closing the short calls for a loss, the remaining open position shows a $210 gain. The position is now long 227 Deltas meaning TLT needs to continue higher in order to make a profit. This is an October position and it fits a longer term bullish perspective on TLT. That is my bias for now which is why I closed out the October short calls. Was the time right to make that change? The contrary side of the equation based on my understanding of Jack’s Friday /ZB (bond futures) chart projection is that TLT is due for at least a 1% – 1.5% pullback here in the next week or so. So how do I protect the profits of the longer term bullish position on a short term pullback? I would like to do even better than that. I would like to limit the draw down in or actually increase the profits this coming week as well as increase my potential profit on a continued upside move after this week.
Below is a potential adjustment to the position; buying 3 Sep15 TLT 125 calls and selling 5 Jul28 TLT 124.50 calls for a $.90 credit. After the adjustment the position would be essentially flat Deltas. An immediate 1% – 2% drop in price would give back $46 – $162 of the profits.
At the end of next week, the risk profile below shows the projected profit/loss for the week’s price activity as well as the what the position’s open profit/loss will be after the close on Friday. If TLT finishes the week unchanged the position will have a small profit. The anticipated move of approximately 1% lower will see profits increase by $164. And what if there isn’t a pullback in price? The position will give back some, but not nearly all of it’s profits. The only real draw down happens if TLT were to fall by more than 1.5% next week. If I thought that was most likely I would simply adjust this position by moving by strikes down by $.50. That would result in selling the 124 strike instead of the 124.50. I want to be short the strike that corresponds with where I think the price of TLT will be at the end of the week.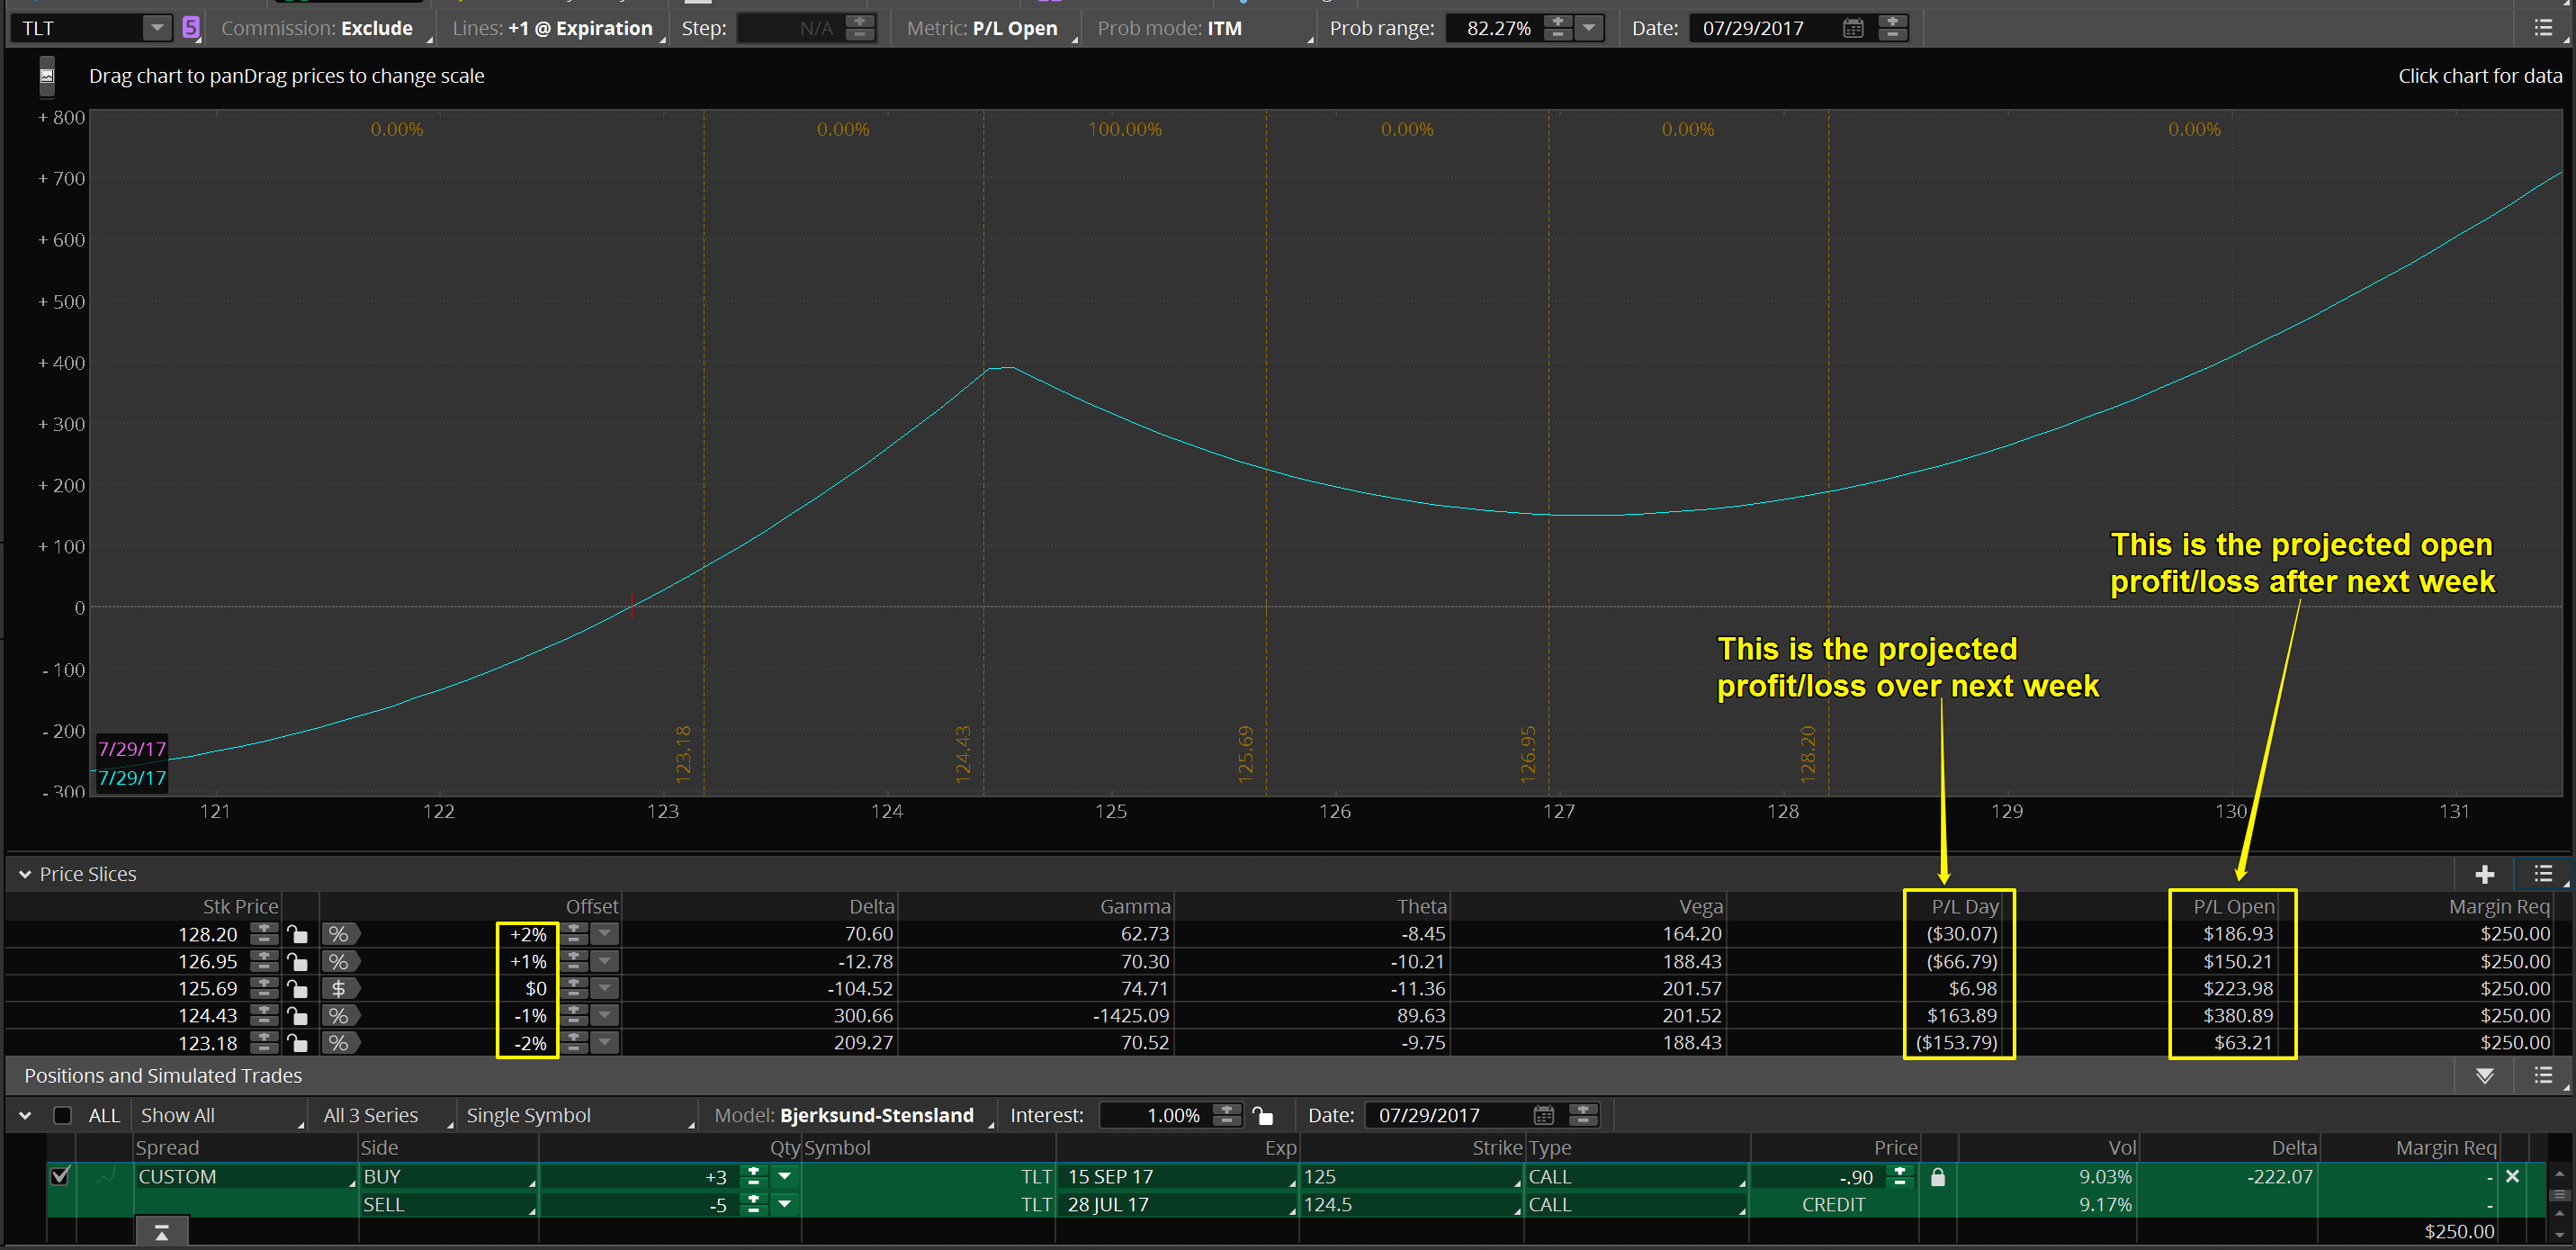
There is another way to look at the position post 7/28 expiry. Instead of closing the adjustment position completely, if TLT is at or below 124.50 at the close on 7/28, the short calls expire worthless leaving the position with the 3 long Sep15 TLT 125 calls. How much will I have paid to own those calls? Nothing, well, better than nothing. I will have received a credit of $.90 to own them. It’s nice when you get paid to own an asset. Below I have simulated what the position will look like after 7/28 if that scenario occurs. The position would be long over 300 Deltas and a 2% move higher in TLT would give the position a $1,500+ profit as of Sep15.
Is this position now out of sync with Stan and Jack’s longer term call on TLT? Possibly, but not necessarily. By considering the adjustment I’ve put myself in a position to potentially buy another week’s time to see if their price projections change to the alt count. TLT seems to be at an inflection point this week and I reserve the right to change my directional bias. For this coming week I think I will be synced up with projections. I’ll let you know next week how this position has evolved. 
I tweeted this to Art of Chart subscribers from 7/18: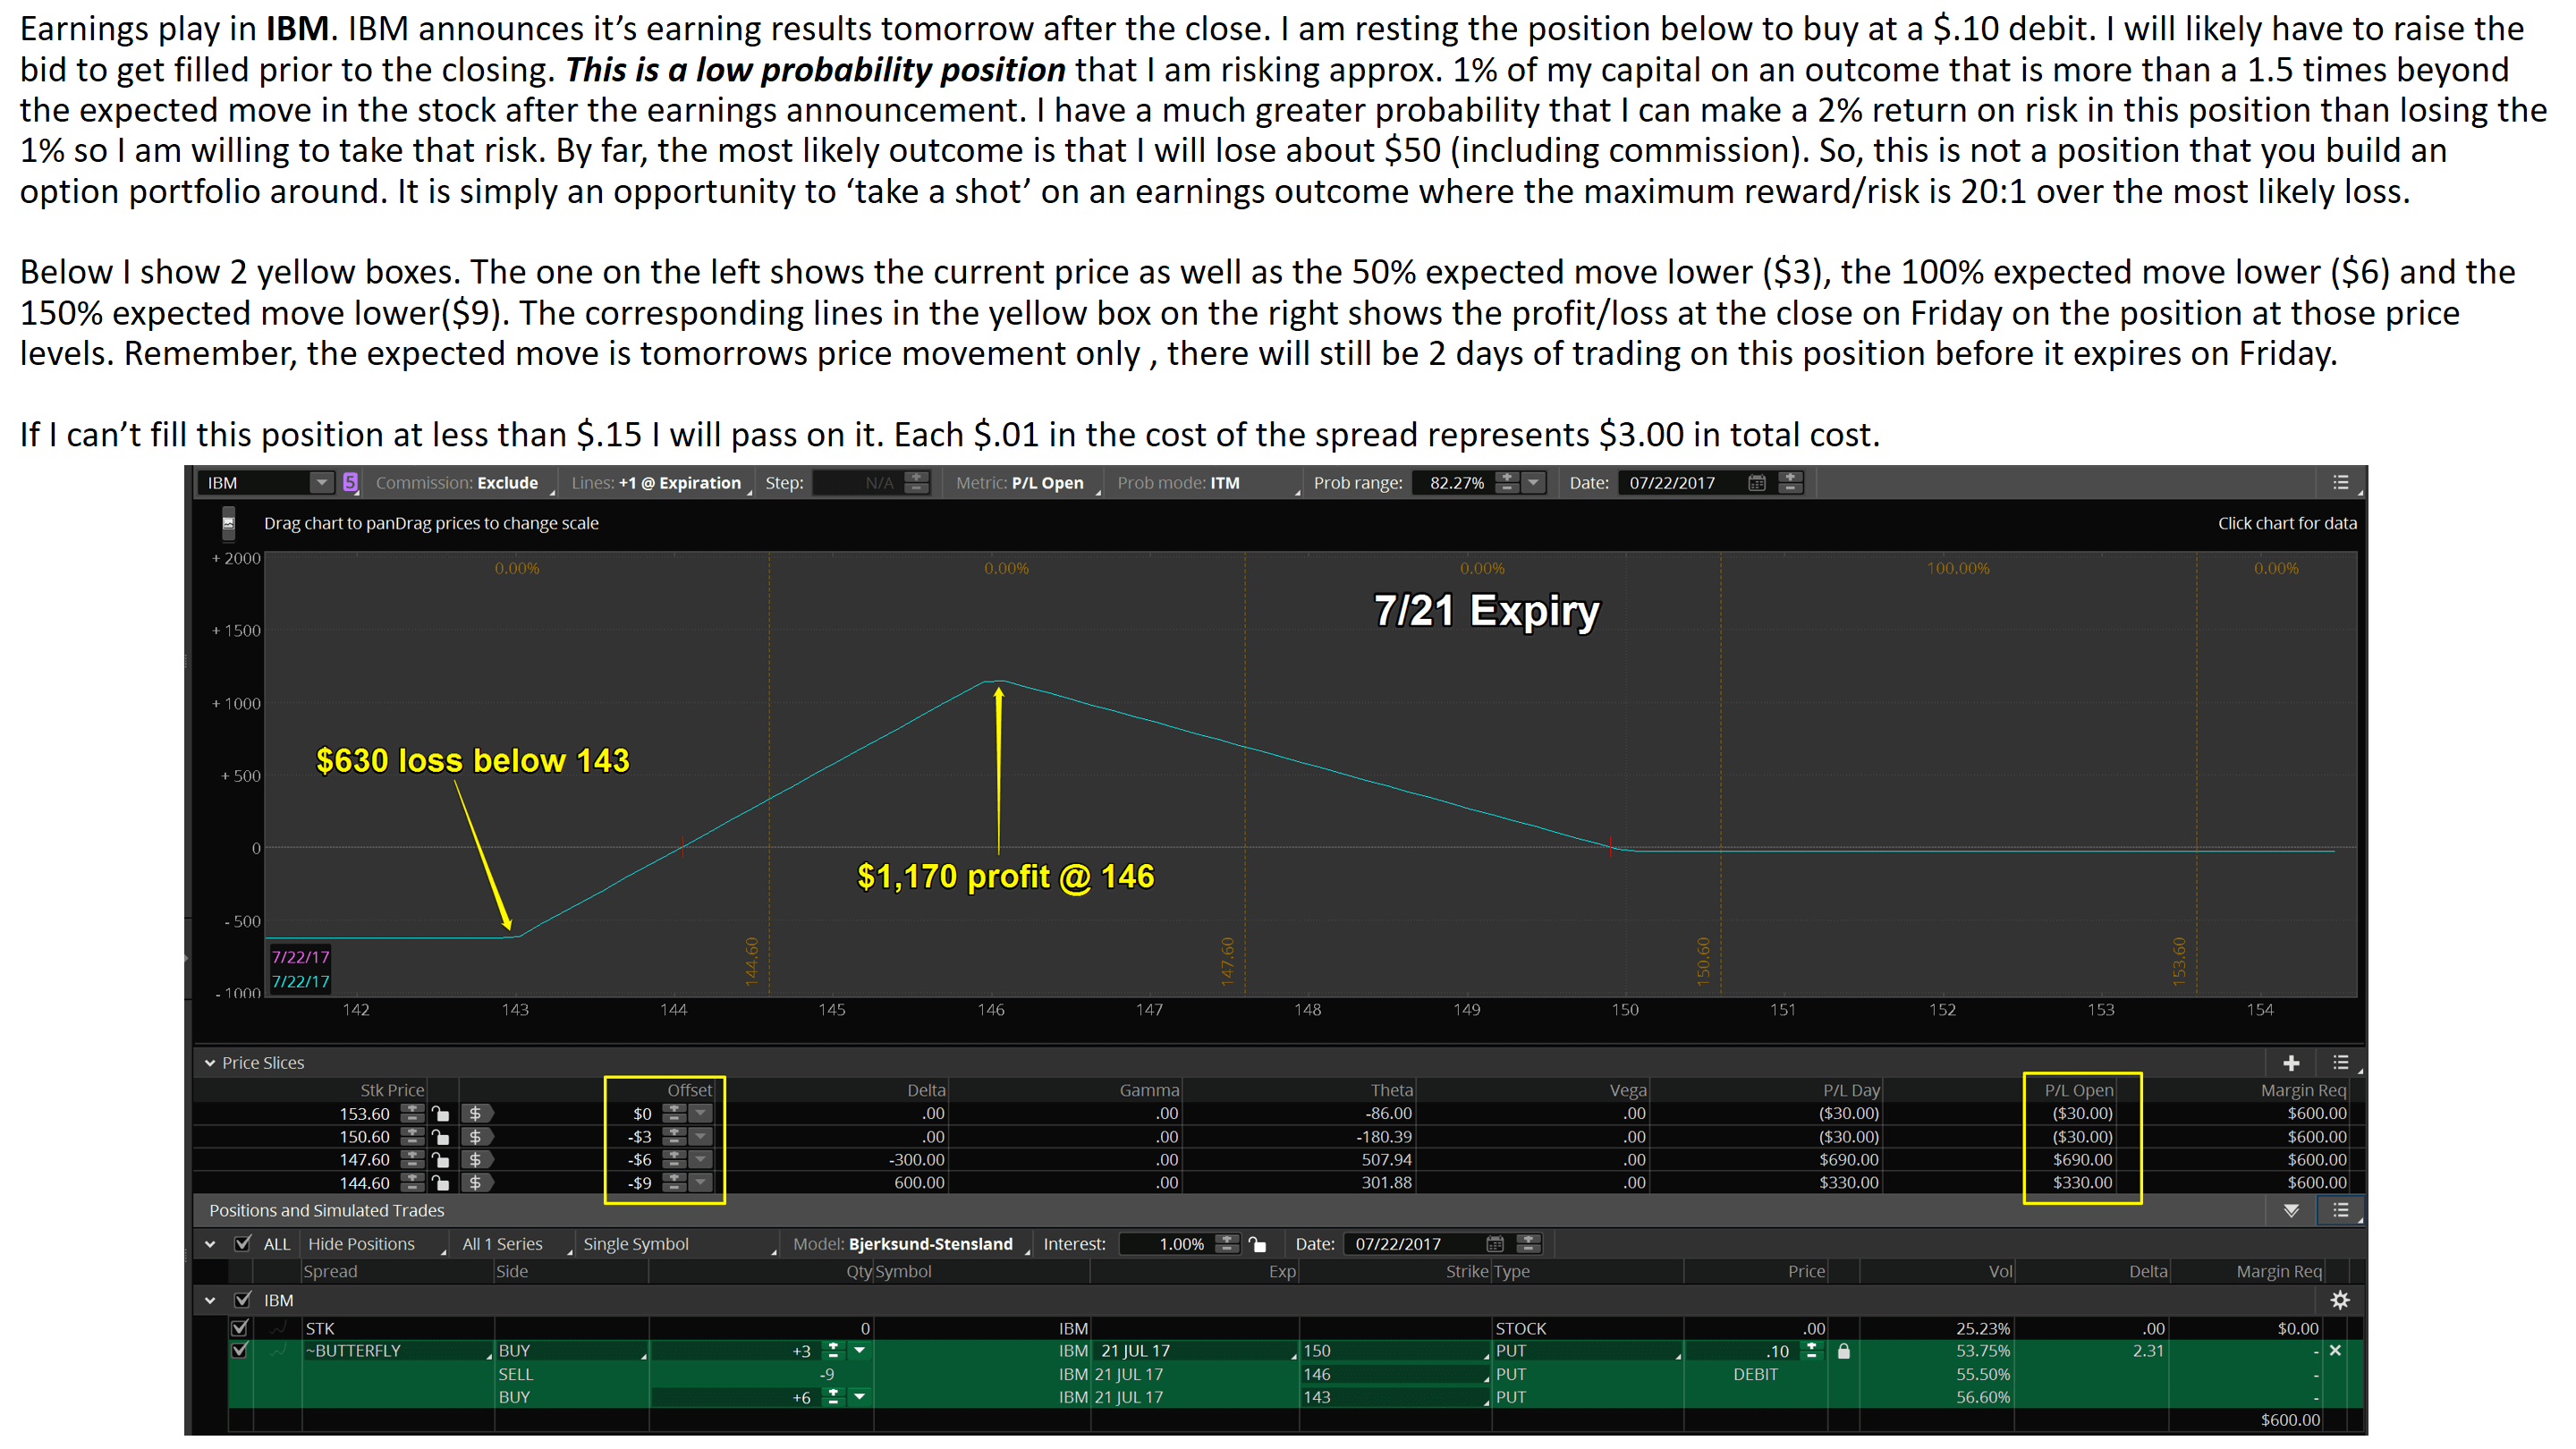
I did not get filled on the position as I was too cheap to pay the $.30 debit needed to get filled. However, this is how the position evolved without me profiting from it.
This is after the earnings announcement. At this point, the position would have had a ($483/$690) 70% profit in one day. 
After the close on Friday the 150 puts were worth $2.95. The rest of the position expired worthless so there would be no point in closing the Butterfly. I would have simply sold the 150 puts for $2.95 and, after subtracting the $.30 cost, booked a $2.65 profit. The final tally would have been a $795 profit vs. a max loss of $690 or a 120% gain in less than 3 days.
Below is the current position in AAPL. It is a long-term Stock Replacement Strategy that deserves a place in any of my option portfolios. Why do I call it a stock replacement strategy? What advantages does it have over simply buying the stock? As you can see below, the position is profitable as long as AAPL’s price is below $158.34. There is no risk to the downside. That is not a benefit of owning the stock. This position doesn’t benefit from a large, immediate move higher like owning the stock does. That has been the big advantage to owning the stock over the past year. Will that continue? Stan doesn’t project that to continue in the Big Five Chart Service view of AAPL. If you are not a subscriber consider the 30 day free trial to see where he and Jack think AAPL (as well as NFLX, AMZN, FB, TSLA) is headed over the next year.
If I decided to hedge the position to minimize current upside risk I could do so any number of ways. One way is to simply sell a $5 wide, nearest out-of-the money (OTM) Put Vertical Credit Spread (aka Bull Put Spread). Selling a 10-lot would take the Deltas on the position from -79.72 to +2.65. The position would then be essentially neutral at the current price of Apple’s stock. Notice the adjustment didn’t cost the position any of it’s Theta. In fact, it increased the Theta by 40%! How much Theta would accrue over the next 187 days? The current loss on the position is $49.83. If AAPL is at it’s current price @ Jan2018 expiry, the position will have a $5,205 profit. That means the position will accrue $5,254.83 in Theta over the next 187 days. That is an average of $28/day in Theta. In percentage terms, that is almost 4%/week. In comparison, the stock pays a dividend of 1.69%/year. I wouldn’t anticipate holding the hedge all the way through expiry as Stan is expecting a large move lower in AAPL but I can add the hedge and then take it off at any time I want to increase my short Deltas again. This is something I will consider adding early this coming week. This adjustment can also be used to hedge an earnings announcement. BTW, the hedge would not add to the margin required.
On June 11th I began keeping an updated comparison of how this strategy has performed in comparison with owning the stock so we can all see how it is working. The option position I established used up $5,000 of margin. For that amount of margin, I could have instead bought 72 shares of AAPL stock at $139.79 on 3/1/2017. On 7/23/2017, AAPL closed at $150.27/share. If I had bought the stock my profit would be $754.56. The option position currently has loss of $164. That means that the option position has under-performed the stock purchase by $918.56.
This was the question I asked on the June 11 webinar when the stock position was out performing the option position by $918.68: If I was allowed to switch positions and take the stock position and the open profit but I had to hold whatever position I owned through Jan2018 expiry, would I make the switch? My answer? Not a chance! As we get closer to Jan2018 it will become obvious if I made the right decision.
What if the price of AAPL on Jan19, 2018 is the same as the current price($149.04/share), what will the stock and options positions be worth then? The stock will still maintain it’s current $754.56 gain plus accrue $136.08 in dividends for a total stock profit of $890.64. The option position will have a total option profit of $3,220. The option position will out-perform the stock position by $2,329.36 by Jan 19, 2018 if AAPL’s share price then is the same as the current price. 
Why longer-term positions make up the majority of the Art of Chart’s option portfolio.
Consider the AAPL position I just discussed. I established the position when AAPL was trading at $139.79 on 3/1/2017. To be profitable, AAPL could trade higher or lower or unchanged but the area where the position would lose at expiry was above $158.34. The area where the trade would be unprofitable immediately after the position was established was any price higher. In other words, the position was short-term bearish and long-term neutral to bullish. So what happened after I established the position? Of course the stock moved against the position and traded as high as $156.65 on 5/15/2017. Any bearish to neutral short-term (less than 60 days) strategy gets blown up and takes a loss as it expires. With this position I was able to ride out the storm and keep the position which has now turned profitable.
So what about the short-term traders? You can still be a short-term option trader and utilize longer-term option positions. Let’s look at the week of 6/12 – 6/16 in AAPL with the Jan2018 position that I own in the portfolio. Let’s say I felt AAPL was going to have a bad week and I wanted to take advantage of that. What if I didn’t already own my current position and I initiated it just before the close on Friday, 6/9/2017. So the stock drops by 4.5% but the option position would have had a $600 profit in one week which is a 12% profit on $5,000 margin requirement. If I was a short-term trader I could have closed the position 6/16 and booked the $600 profit. Now, if I knew that AAPL was going lower that week I could certainly have used a much more profitable short-term strategy instead but the problem is nobody knew what the price of AAPL was going to do last week. Stan estimates that good chart patterns play out about 70% of the time which is a huge advantage in trading however no one should take that to mean 100% certainty! Art of Chart option trading is about maximizing the range of profitability that you can get with longer-term positions while incorporating Stan and Jack’s price and time targets to reduce the cost basis of entering the positions. This method will produce slower profits but fewer losses and, over time, more consistent profitability with lower trading costs.
That is all for this week. If you have questions or comments you can post them here on the blog or if you are an Art of Chart subscriber you can post it on the private Twitter feed. If you are not a subscriber you can sign up for a 30 day Free Trial to try out the service. What have you got to lose, it’s free!
Save
 05th Aug 2017