Crypto-currencies are now becoming more mainstream, and I am providing charts on this blog on a weekly basis. I plan to cover just three cryptos: Bitcoin, Litecoin, and Ethereum. The point of the weekly post is to show the crowd psychology behind the price movement and to find profitable trades among these instruments. These instruments are now easily tradeable through the CBOE and ETFs.
$BTCUSD is between the lower and middle bollinger bands, and thus far, the middle band is resistance. If this continues this week, we may see the alternate path lower which would be a definitive buy signal with a double bottom. Convert middle band into support and we see the next 5 wave sequence higher
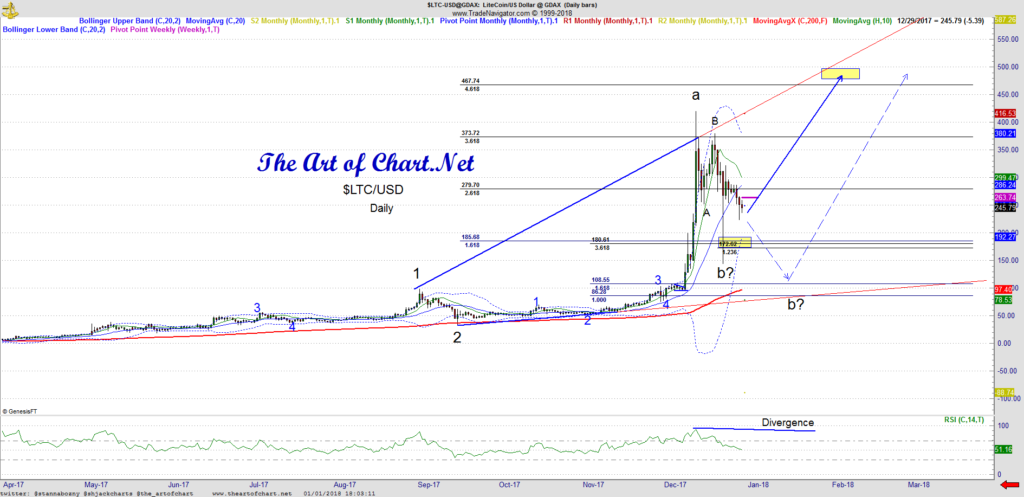
New highs are expected: BTCUSD around 22000-22500, ETHUSD 950-1000, and LTCUSD 420-460. I am looking for Negative Divergence on RSI for a short setup when we see those target areas. This next legg up will require the middle band to be support which is currently not the case in two of the currencies.
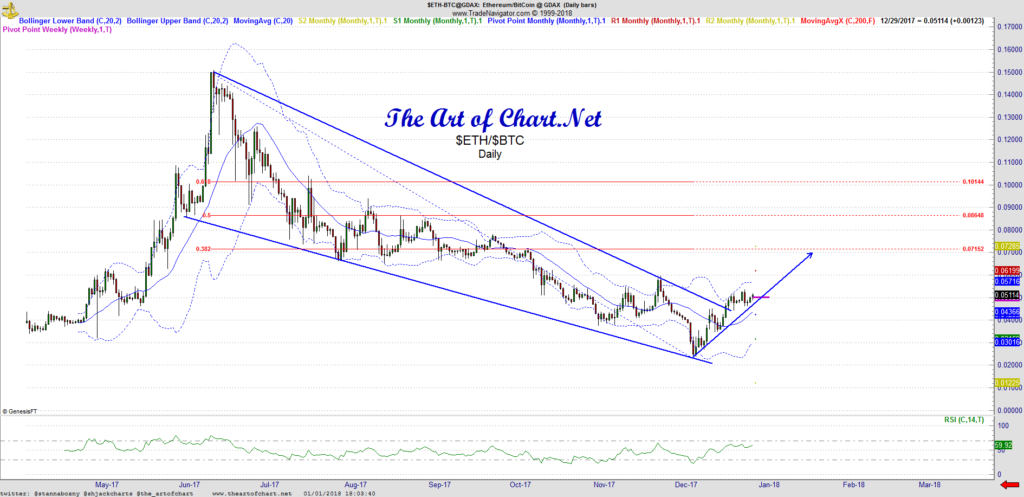
On the ratio charts, I would expect BTC to lead the way to the upside and the ratio charts for LTC and ETH to decline. Currently, I am expecting this on LTCBTC and we will see if the ETHBTC resolves into an inverted head and shoulder pattern.
I will be covering intraday charts next week and look to expand coverage of these three currencies. The crowd is still getting into the instruments so I don’t see a bubble popping yet — more to come next week.


 01st Jan 2018