Anytime someone mentions a correction in the S&P’s usually traders associate it with a crash or some bold prediction some pundant makes to get attention. This post is neither of these, just some simple charts showing signs that a downturn is looming and perhaps will begin in days. Listen to your charts, here’s what mine are saying:

SPX Monthly Chart – The Big Picture, a few things to note:
1. The current RSI price cycle has broken it’s trend line and there is divergence on a monthly basis. What does this mean? Bulls are on borrowed time and a pullback is coming. Remember now this is a monthly chart so borrowed time means months. Note what happened in 2007 – we broke the rising price cycle trend line and then back tested it and then the decline started. Patterns do repeat, I am watching this with interest.
2. Note the 161.8 reverse retracement from the 2009 low – 2138ish – this is significant resistance. Can we get through here? I don’t know, I only know that it is a key decision point that the market has already tested once. Fail twice an lookout below.
3. Note the two yellow fibs on the chart – this is the depth of the retracement I am expecting – yes, a maximum of 15% from the current high. Is this a lot? – Not really considering where we are in the structure which I will explain below. Will it happen quickly like some are predicting?? No – dip buyers have been trained for four years that dip buying works. This decline is going to be a fight tooth and nail the whole way. Will we see 2% days – sure, but this?is not going to be anything like 2007-09.
4. Note Price in Time on the vertical?timeline?- March 2016 low, more on this in the cycle chart below but simple put a decline through mid July followed by a rally through end of Sept, maybe early October then a killer move down into March 2016 for Wave 4. I will update this timing as this unfolds with future posts.

SPX Weekly Chart – Layering in more detail and a few things to note:
1. Notice the contracting nature of RSI since October of 2014. This is a signal of a topping pattern called an ending diagonal. What is that? Simple put a rising wedge that terminates an impulsive move. This is discussed below in some detail but for now if you see this on a weekly basis, it calls for momentum expansion and a terminating move for this impulse.
2. Notice the divergence since July of 2014, price then was 1985 and since then price and RSI have diverged strongly.
3. Also?note that the high of the VIX/Price ratio occurred back in June of 2014. It?reached 188 and has diverged strongly since then just like 2007.?The VIX/Price ratio?high in 2007 of 145 occurred in February and?10 months later the decline started. Patterns do repeat and divergence of VIX/Price is a classic sign post of? the coming decline.
4. ?We are in an extended 3rd wave from 666 which is shown on the chart as ending here soon. Seen in more detail below.
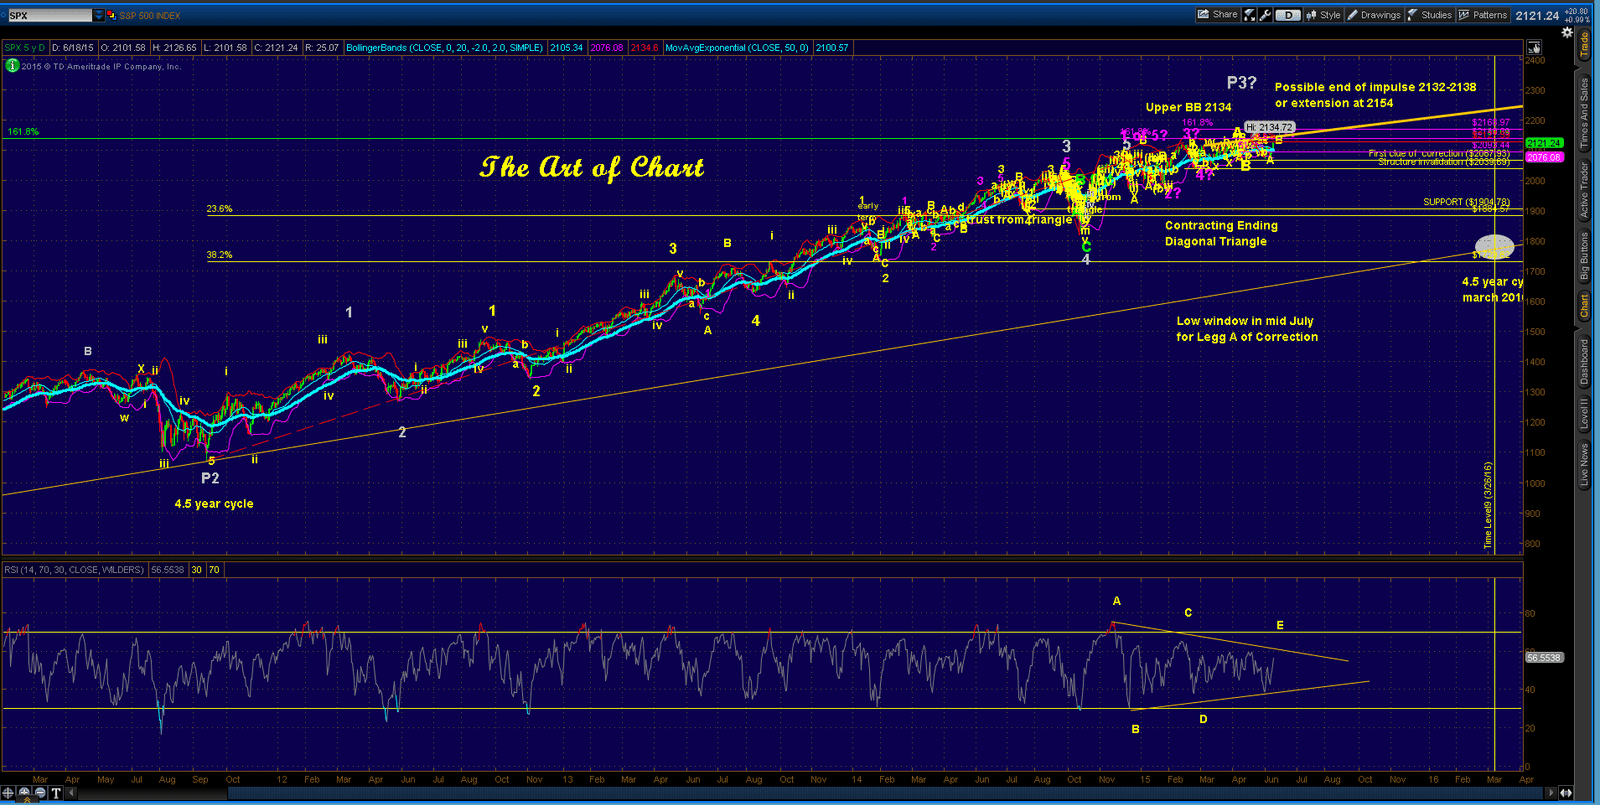
SPX Daily Chart – Layering in more detail and a few things to note:
1. The 5 wave move from Sept 2011 is much easier to see on this chart and?will?complete the 3rd larger degree wave of this impulse. The 4th wave is 1820 and we?may be finishing the?5th wave now as an ending diagonal. Possible end of impulse for this sequence is 2132-38 or the extension at 2154. The expected retracement is back to 1820. Can it go deeper? Sure but let’s not get ahead of ourselves, we follow price and trade it accordingly.
2. Note the upper Bollinger Band? for tomorrow is 2134, a punch there is a double top and probable resistance.
3. Again, the clear contraction of RSI which is a clear signal of an ending diagonal and a coming expansion.? Triangles are much more reliable when RSI is contracting – see DX and CL for examples of recent triangles with clear thrusts which occurred from contracting momentum.
4. A few fibs to note – structure invalidation is 2039 so the bears have done no technical damage yet. First clue of a correction is a break of 2067.

SPX?4 hr?Chart – Layering in more detail and a few things to note:
1. The Ending?Diagonal Triangle is now clearer – both on RSI and price. See the diagram below?for more detail. Basically this is a rising triangle which originates in the 4th wave position and calls for a complete retracement to 1820. Idealized drawing below and remember, nothing is ever ideal in trading. : )
2. With charts I show scenarios?and possibilities and trade accordingly as price action dictates. The?above chart shows two possibilities for Wave 5 – either it already happened or we may be putting it in now. Either way, the coming correction is close at hand. More on the preferred count below. Any touch of the upper BB at 2134, or a penetration of the resistance trend line at roughly 2142 is a clear sell. The preferred count below favors?an earlier target.
3. Note the fib target at 2040 as an initial support?target on the way to 1820.


SPX 15 minute Chart – Diving into the detail and?more to note:
1. My preferred bearish count is above. With 2134 as the high we have? a w-x-y down to 2072 and a corrective move in an a-b-w-x-y-x and a 5 wave extension. We may see a marginal new low at 2116 tomorrow morning on the open and then higher into 2134-40 for completion of wave B. Early termination here also possible. Triple witching tomorrow with stats that say prices up 9 of the last 15 – is she gonna be a good witch or a bad witch ?? : )
2. Another scenario just as valid is a back test of the trend line that was broken today then higher. Lower odds but possible. Watch for a morning low and a grindy move higher into expiration.

Emini S&P – Placing Price in Time:
1. Placing price in time is more art than a mechanical interpretation. The above chart is a nice clear depiction of high and low windows which helps me listen to my charts with more clarity. You can easily project what you want to happen on any chart you create, listening to your charts requires you to look across multiple instruments, methods and timeframes to get a sense of how they all line up. When everything lines up – you have one heck of a trade.
2. This chart is showing a small high window tomorrow in pink but then look at July 17th – the cycles line up for a significant low. A cycle is nothing more than a cycle bracket on different time frames. The 40 week cycle low?center date is July 17th along with other smaller cycles. The 18 month cycle low is in March of 2016. These are two windows to watch. Does this mean that price will go down? ?- NO – nothing?is guaranteed in trading?- It does mean that timing cycles will be exerting downward influence on price between now and then. I will update the cycle chart events? over the coming month.

TF – Four Hour Chart and a few notes:
1. When listening to your charts, find sister instruments. I use the Nikkei and the Russell as sisters to the mother of all indexes, the S&P. Find the easiest instrument to track and work it every day. The Russell lately has been giving great clues. Early in a bull market, these instruments will not be aligned and mostly doing their own thing but near a bearish turn, they tend to line up well.
2. The Russell is an easy count – seen here a simple 1-2-3-4 and a three wave move in wave 5 with a small triangle. 1283-1286.50 as initial resistance and 1320 as an extension. In short, not much time left before a retracement begins. Any break of the channel currently at 1243 is the beginning of a bearish move.
3. Nice divergence from the Wave 3 high, a sign of the 5th wave. RSI price cycle near completion.
So are you listening to your charts? Well don’t listen to mine!! After all you have to trade from what you believe and not swallow what others say, including Jack and I. I hope this post helps you see what I see in the charts as of June 19th, 2015. Hopefully?now you have a few new ways to listen to your charts.??More tomorrow. : )
 19th Jun 2015