The Options Trading and Investing service provides perspective on high quality setups and option trading strategies for the coming week. We carefully select these setups due to their quality and profit potential and we report back on results. Today we review current portfolio performance and a new position established in the RUT. Stan and I also discuss potential adjustments to the current IYR and IBB positions as well as TSLA.
Please refer to our education video HERE for more information in the option strategies used in this post.
The entries and cost basis of new positions will appear on our private twitter feed during the coming week.
The option portfolio closed the week with a total profit of $1,129.50 since mid-February inception. The average margin used over that time period has been $20,000 which gives the portfolio an approximate 25% annualized return on margin to date.
4 of the underlying instruments continue to move against our positions but the structure of 3 of those positions is still good but we could consider adding some risk to both IBB and IYR. The fourth, TSLA, is one that I will take a look at later in this presentation.
The best open position is short USO (oil) with a $627 profit. I added a small long USO hedge that will be closed out after an expected upward retracement in price.
I will likely be initiating a new short-term bullish/longer-term bearish position in Silver this week. To accomplish that I will utilize a Ratio Spread similar to the one I use in USO on 3/27.
I sold 5 May19 USO puts to create a flat Delta position in oil. Stan expects a short term bounce in oil but the current primary trend is still lower.
RUT provided us with good trade location for a new downside position this week and I placed a trade on Thursday. Can I reduce the cost and risk in that position already? We will review that coming up.
All new trades will be posted on the subscriber Twitter feed.
The current position in TSLA has about $700 of risk to the upside should the stock price continue to move higher. In this option portfolio I will generally risk up to 2.5% of the $50,000 portfolio value in any 1 position. That equates to $1,250 of risk so I have some room to add to the upside risk if Stan thinks the chart warrants that change. If we are willing to pay $330 to buy the Jun16 TSLA 300/290 Put Debit Vertical Spread we can raise the Jun16 break even stock price from $263 to $292. So, $330 of additional risk buys the position almost $30 in a higher break even stock price. Stan thinks that adjustment makes sense but would like to wait as TSLA may have one move higher still.
Un-hedged USO position on the left (below). Without the hedge, if USO went 7% higher in the very short term, the position would give back almost $350 of it’s current $630 profit. That is because the un-hedged position is short 390 Deltas. After adding the short May19 puts, the position is short just 62 Deltas. Now if USO moves higher by 7%, the current profit will be reduced by $191 instead of $350. Why not hedge it so the position profits from the expected move higher or at least doesn’t give back any current profits? Each options trader is different. My style is to reduce my Delta exposure on a counter-trend move but I don’t want to over hedge. In the current example, the primary direction in USO is lower and Stan is still expecting a strong move lower to resume shortly so this upward retracement could well come up short of expectations. Corrections against a primary trend can also be through time instead of price so, again, I tend to under hedge. The current hedged position could return another 4% on margin over the next 20 days if USO does nothing at all or moves slightly higher. 4% doesn’t sound like much but that is an annualized return of 73% and is good use of the portfolio’s margin.
At 10:32 on April 27th I tweeted out the establishment of the new RUT position. That is a service we currently offer to all ArtofChart.net subscribers who follow us on the private Twitter feed.
I try to tie together Stan and Jack’s chart analysis with good trade structure to design option positions that will achieve maximum profitability at price and time targets that are taken from the subscriber charting service. In this instance, Stan has had 1422 set as a potential high target in RUT for many weeks now. Last Sunday he mentioned if RUT held the weekly price pivot get ready for a quick move higher. That is exactly how it played out. Then, as the week progressed, Jack was seeing a favorable reversal pattern developing in the short term where 1422 looked like a very good potential top. Lastly, notice the yellow box on Stan’s chart. The cycle high window indicated a likely turning point currently so when multiple signals come together like that I am willing to establish a defined risk position without a confirmed reversal pattern. Can I manage this position going forward to reduce risk and still maintain good profit potential? First, lets look at the risk profile of the position.
Below is the new RUT position. This is known as a Broken Wing Butterfly (BWB). Current open profit of $300 is a 17% return on risk in 1 trading day. The RUT is down 1.5% from the price at which the position was established so you can get an idea on how much leverage a good option position can provide. Now, as everyone is aware, the current market has been seemingly unwilling to correct substantially. Every small pullback has been met with buying. Is there a way I can reduce upside risk while still maintaining downside profit potential?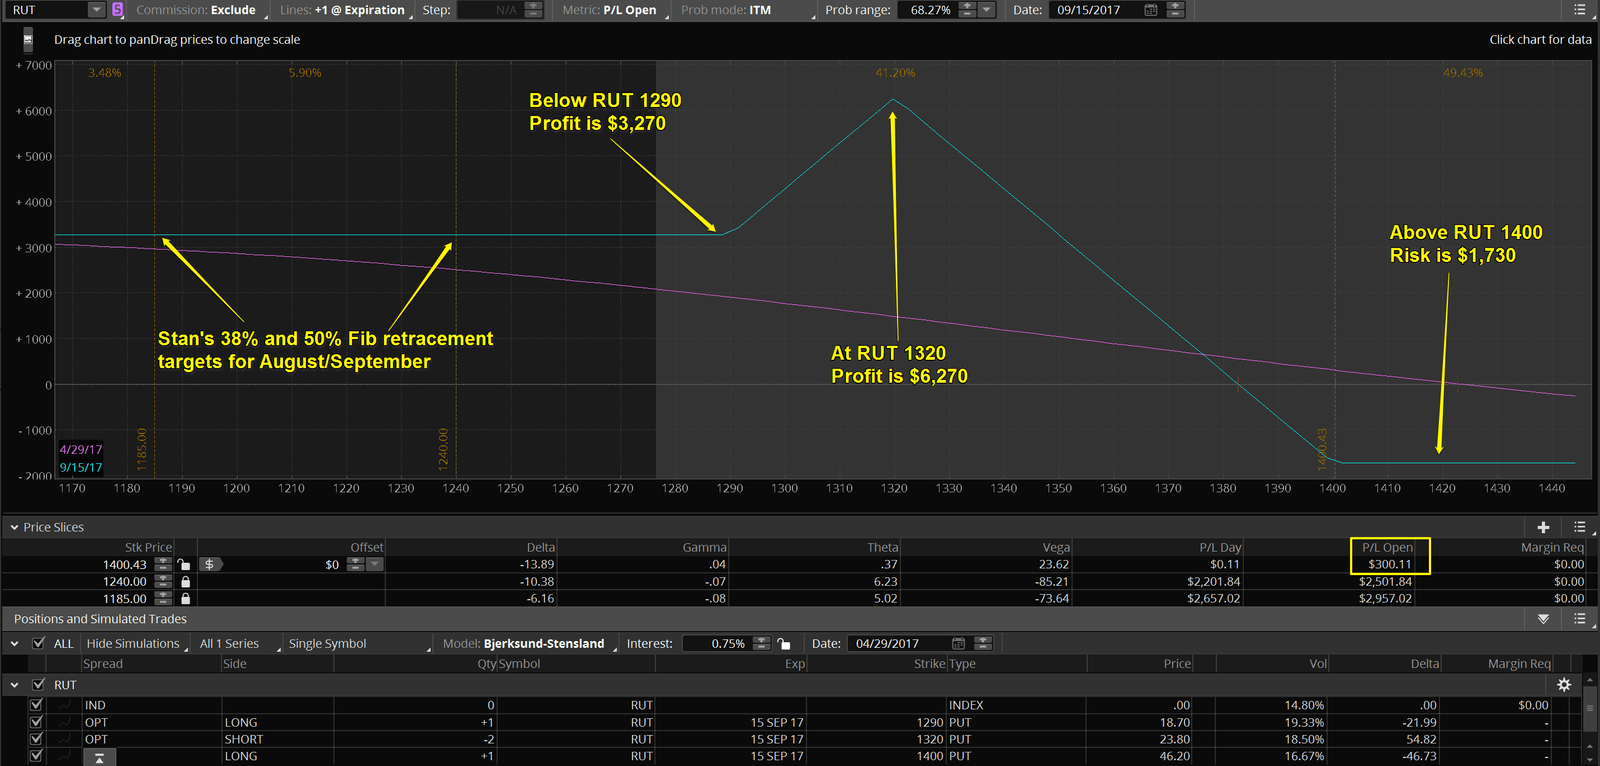
Below, with this potential adjustment I could maintain a more bearish position while still reducing the cost basis by 90%. Based on Friday’s closing price I could roll the 1400 put down to 1360 for a $15.45 credit ($1,545). Subtracted from the $17.30 debit ($1,730) cost basis of the original position, the adjusted cost basis is just $1.85 debit ($185) with a maximum profit potential profit of 20 times risk and, on a move lower to Stan’s target prices, a reward/risk ratio of over 4:1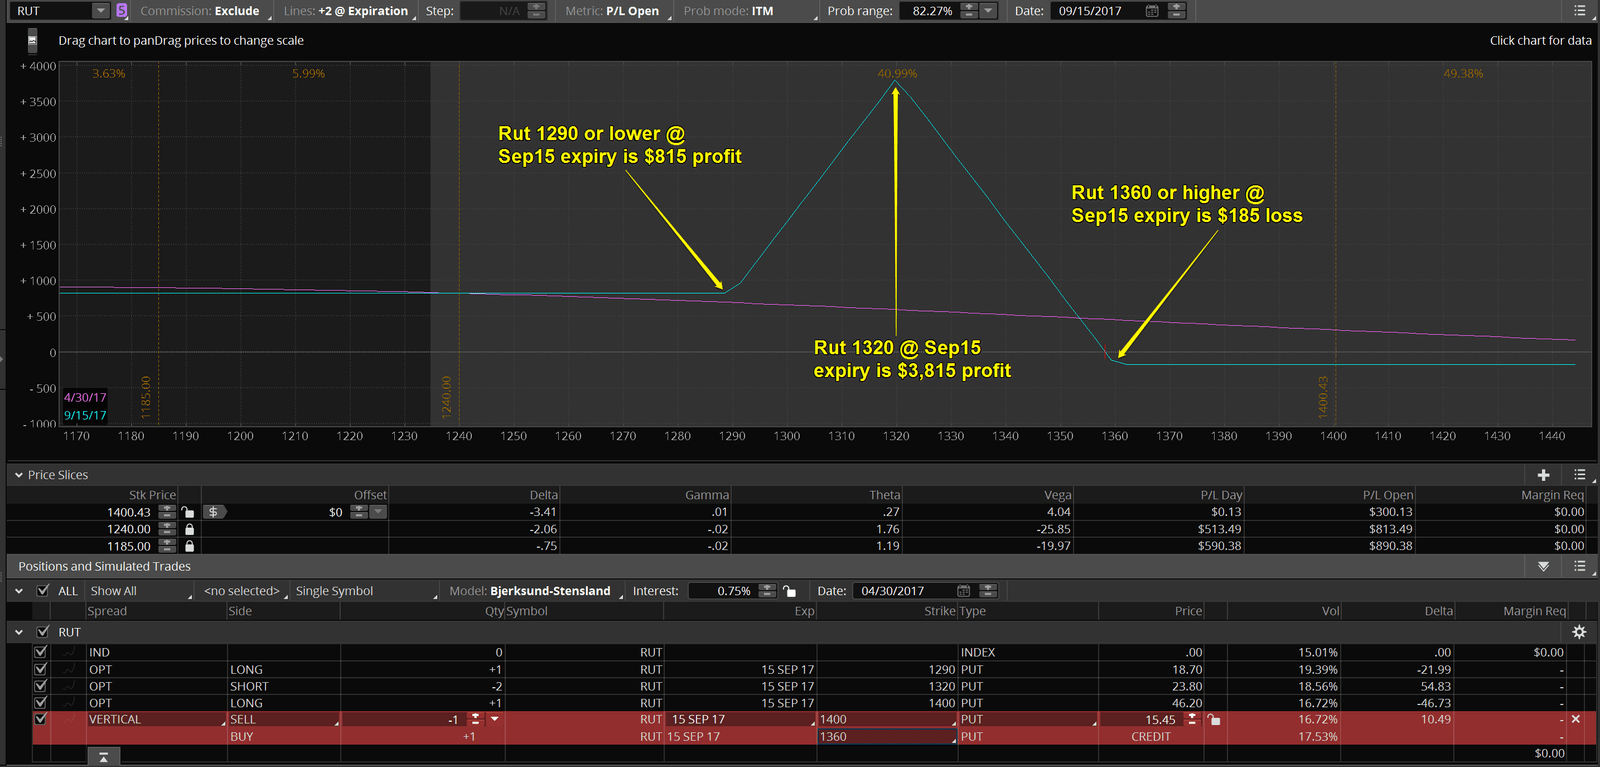
Finally, if RUT were to drop to approximately 1380 and I rolled the position at that time, I could expect to collect a $17.40 credit. That would then lock in a $10 profit for the position while allowing for up to a maximum $4,000 profit at expiry. If we see Stan’s Fib targets by August/September the position would see a $1,000 profit on a no risk position. Again, if the portfolio owned this position I could add another BWB after a retracement higher when Stan thinks a next big wave lower is coming to allow for really leveraging up the potential profits while keeping my risk profile within my 2.5% of portfolio risk guidelines. The idea here is to add no risk positions to the portfolio if possible to increase the profit leverage available through well managed option positions.
Save
 30th Apr 2017