The Options Trading and Investing service provides perspective on high quality setups and option trading strategies for the coming week. We carefully select these setups due to their quality and profit potential and we report back on results. Today we review current portfolio performance and a new position established in XRT. I also discuss an additional Ratio Spread in IYR and the evolving position in RUT. Finally, I check back in the AAPL Stock Replacement Strategy to monitor it’s performance.
Please refer to our education video HERE for more information in the option strategies used in this post.
The entries and cost basis of new positions will appear on our private twitter feed during the coming week.
The option portfolio has a total profit of $969 since mid-February inception. The average margin used over that time period has been around $20,000 which gives the portfolio a 20%+ annualized return on margin to date.
The most profitable open position is the short USO (oil) position with a $543 profit. Just below that position in profitability is the RUT Broken Wing Butterfly w/ hedge that finished the week up $525. The remarkable fact about that position is that the total risk is just $260 so the position is currently up over 200% on risk.
Last week I added a new position in XRT which is the retail ETF. The position is a Sep15 Vertical Put Debit Spread that was purchased for a .99 debit.
The worst performers in the portfolio continue to need only a move of 2-3% lower to be profitable and they still have 4 months to expiration so those positions are still a hold. VXX needs a spike in volatility in order to be profitable and there are options expiring in June as part of the position so that may need an adjustment in the next couple of weeks.
All new trades will be posted on the subscriber Twitter feed.
This is the IYR position after the May 3rd trade. $875 of risk if IYR is above 78 @ Sep15 expiry, $2,225 profit if price is between 68 and 73 @ expiry. Profit then begins to decline but position is profitable anywhere between 60.59 and 76.24.
Tweeted this intended trade adjustment on May 1st and actually got filled on May 3rd. Patience pays!!!
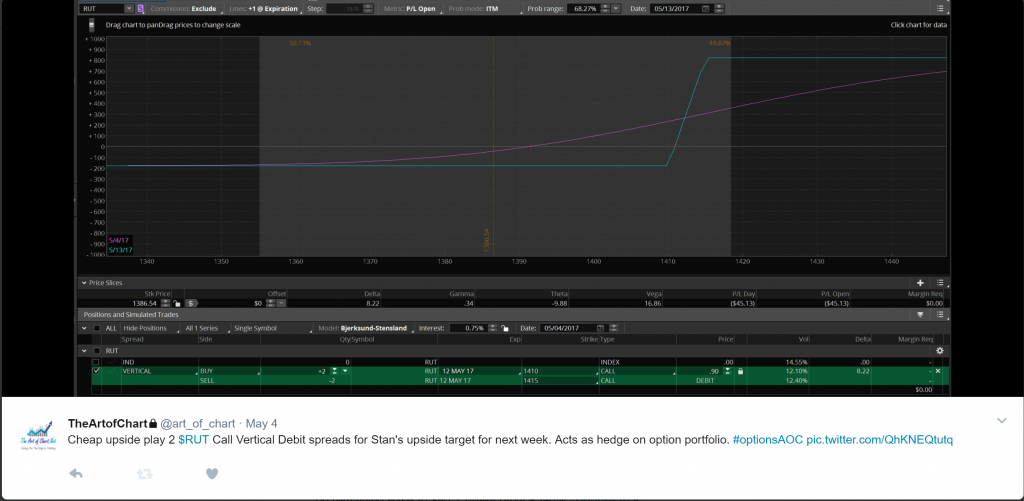
On May 4th I added an inexpensive hedge to the RUT position as well as hedged the overall portfolio slightly by buying a 2 lot Vertical Call Debit Spread. The spread cost $.90 and could potentially be worth $5.00 if RUT is above 1415 on May12 expiry. I am risking $180 to potentially make a profit of $820. This is also a portfolio hedge because I am short multiple positions that generally are highly correlated with the RUT.
Here is the current RUT position. The current profit is $525. If RUT finishes this week in the 1415 to 1420 range the position will be up $1,100 to $1,200. The worst outcome would have RUT finishing the week at 1410 which would leave the position with just a $200 profit. I will monitor this position closely early in the week and see what Stan thinks about the upside in RUT.
The portfolio’s long term Stock Replacement Strategy. This position was established with AAPL at 139.79 with the thought that AAPL was getting close to a turn. AAPL is now close to $10 higher in price so how is the position doing? It is currently down $187 so is the position in trouble? First, the position gets shorter in Deltas as the price of the stock moves higher because if AAPL is above 158.32 @ expiry the position will not be profitable. I am essentially synthetically short approx. 78 shares of AAPL currently. How much lower do I need the stock to go to make a profit? Zero. In fact, is AAPL is at this price level @ Jan2018 expiry I will have a $3,230 profit which would be a 65% return on margin for a 11 month position (71% annualized return). This is unlike any position where you just bought an option because time will repair all of the short term losses of $187 plus add another $3,230 of profit. Nobody like a short term loser but it is much easier holding a position like this than needing a large move up or down to repair a losing position!
Analyzed an APPL 19 JAN Butterfly, Buy 1 145 call, Sell -5 175 calls, and Buy 4 195 calls for a 3.4 credit and it did not seem to matter which way APPL went to be profitable. What do you think?
Ed, anytime you put an unbalanced call butterfly on for a credit you have no risk to the downside. The worst you could do if AAPL is below your long 145 call would be to keep the credit you collected at trade entry because all 3 legs of the butterfly expire worthless. Inside the butterfly you have 2 different embedded spreads; long (1) 145/175 call debit spread and short (4) 175/195 call credit spreads. The most you can make on the debit spread is $30. The most you can lose on the 4-lot credit spread is $80(4 x $20 wide spread). Your max loss to the upside is then $80 minus $30 minus the credit you collect to enter the position. If you collect $3.40 then you max upside loss is $4,660. You max gain if AAPL is at 175 @ expiry is the $30 from the debit spread plus the $3.40 credit or $3,340. Your upside break even stock price is 183.36
BTW, I just looked at the mark price of the spread and if you are considering Jan2018 the mark price is a $3.40 DEBIT, not credit, so you to adjust everything I just explained above to account for the debit.
Thx
I’m starting off with an account of US$10,000. Do you advise if I could use the positions here as a starting point? As I am now flat, I would restrict myself to considering only new positions that you put on.
Jeremy, while I can’t advise you how you should manage your personal portfolio I can tell you how I manage an options portfolio of any size. I prefer to keep each position sized to 2.5% – 3.0% of the portfolio value. In the case of a $10,000 portfolio that means $250 – $300 of risk per position. Many people want to risk more because they want the portfolio to grow faster but I would resist that temptation. I often initiate trades based on larger moves from Stan and Jack’s chart analysis that offer 3 or 4 to 1 reward/risk ratios meaning risking $250 could potentially bring in up to $1,000 in profits. The other key to my success with options over the years, and this is extremely important, is that I use extended duration in my positions. My typical option position uses options with 3-12 months duration. Markets often move slower than anticipated (as in the current grind higher) and if your option positions are very short term you can lose before the anticipated move happens. Also keep in mind that my trades for the Art of Chart option portfolio are based on a $50,000 account size so if you are following along keep your sizing appropriate to your account. Fell free to continue to ask questions along the way and good luck!
Paul, Are there any good books or classes you know of on how to trade Butterflys correctly and how manage trades that have gone against you with options? Thx Ed
Ed, I can’t really recommend any particular books or classes that will help you trade Butterfly’s. I’ve known many option traders over the years that make multiple adjustments to their spreads and end up with positions that lose much more than the original Butterfly could lose. My experience has taught me that when I am in a hole, it is time to stop digging. Butterfly’s are by nature a defined risk position where you define your maximum loss at trade entry. That maximum loss amount should fit your acceptable risk level for any one position within your portfolio. You may have noticed that many of my positions are Broken Wing Butterfly’s. That is because they have a higher probability of success than standard butterfly’s. I also use longer duration positions because time can either be your friend or your enemy. Nothing more frustrating than watching the clock run out on a position only to have price move into the profit area after the position has expired. I often leave the butterfly alone and add another position on top of it. Let’s say I am longer-term bearish on a stock so I have a 9 months to expiry bearish butterfly on and then Stan thinks the underlying stock is going higher over the next couple weeks. I don’t close the butterfly if I think it is still a good position but I hedge my portfolio by adding a 1-2 month call vertical debit spread (a bullish position) to offset it. Because the 2 positions are in far different expirations I can often profit on both. I use that vertical spread hedge to adjust my Deltas to long, short or flat when combined with the Butterfly. Look at the adjustment I made in the RUT Broken Wing Butterfly from last week where I took the risk down from $1,730 to just $80 because it was a bearish Sep BWB and Stan projected RUT higher this week. That was a simple adjustment to reduce risk. Did you get a chance to look at that adjustment?
Yes I had a chance to look at the RUT adjustment. I have added directional calls trades to the AAPL to make up for near term losses there along with eem trade leaving the original trades to work themselves out. Noticed the uup adjustment.
Ed, are your directional call trades in a nearer term expiry than your original trades? In today’s option webinar I discuss another way to try to improve the AAPL position (could apply to EEM as well) but it isn’t an upside hedge. It is a way to make additional profits on a short term downside move without adding any significant risk to the upside. It is hard for me to enthusiastically hedge to the upside on a stock that is so extended. I am tending to really under-hedge any upside moves at this point and what hedges I do have are defined risk such as call vertical spreads so I don’t give up all downside profits from a losing upside hedge when the market does turn around. No naked short puts for me at this level! But that’s just me. The blog and webinar should be posted soon if you are interested.