OPEC and key oil-producing non-OPEC nations met on May 25th to extend Crude Oil production cuts. This key meeting was a force in driving the recent rally in crude. Headlines in Barron’s and internet chatter discussed the rise in Crude Oil prices.
Crude Oil futures sank more than 6% as a result of the production cuts. Why? Analysis said they weren’t enough. OPEC and even Russia were blamed that they had not fixed the production cuts. Does this appear to be a “sell the news” event? This week’s event appears that way but we provided our subscribers a different view.
Leading up to the OPEC meeting, our Daily Update service forecasted another decline coming in Crude Oil.
Crude Oil May 21st:
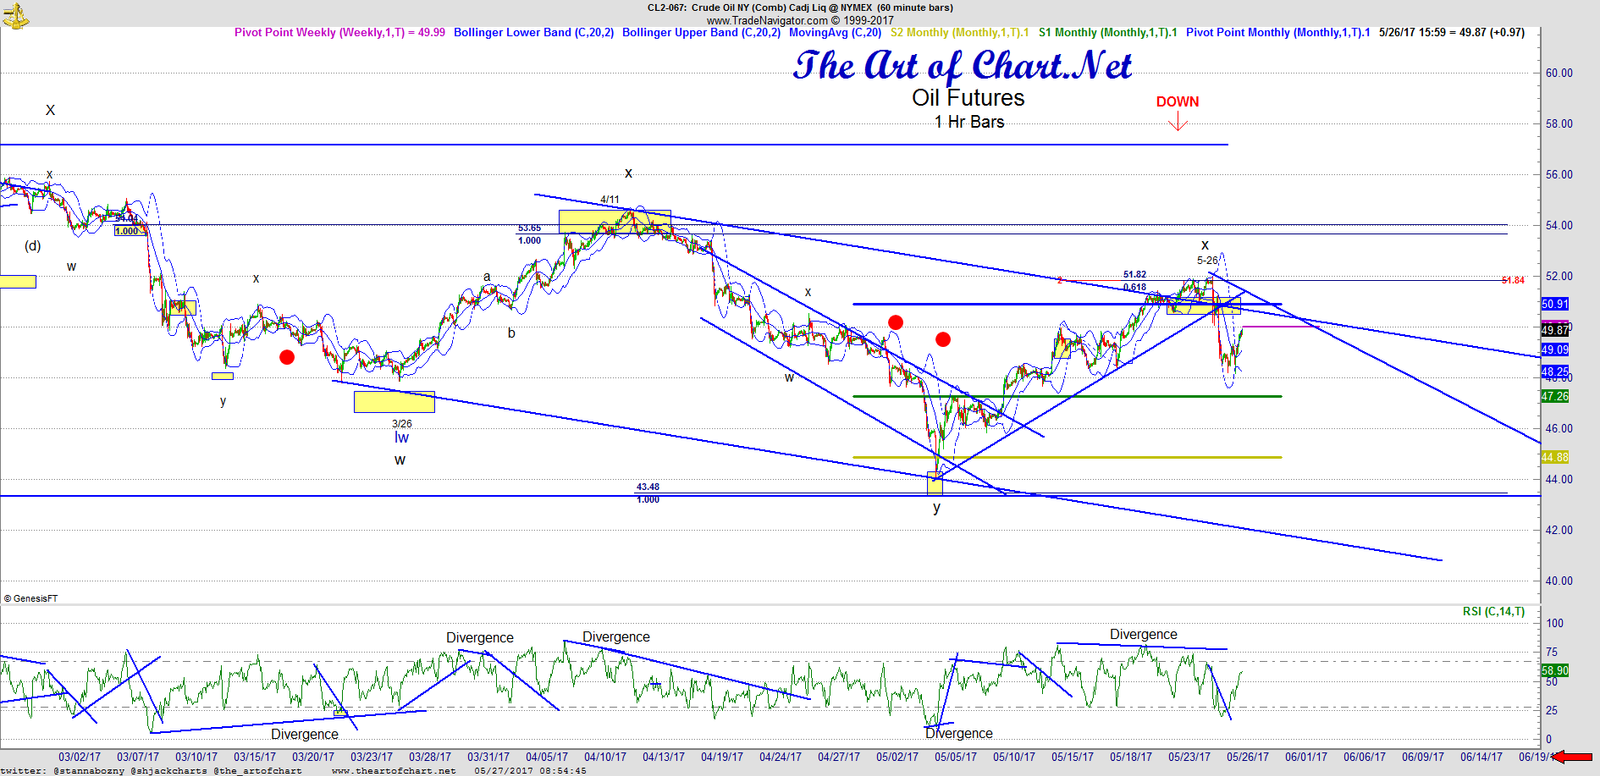
On the weekend update on Sunday, we provided this forecast to subscribers:

The chart showed resistance at key levels of the monthly pivot, a trendline and $51.82-84. This is also a 5-3-5 retracement pattern which is expecting a break of the prior swing low.
Crude Oil May 23rd:
The post market Daily Update Video was posted at 7:00pm and provided subscribers a clear forecast of what to expect next. Resistance at 51.82-84, in the Hurst Cycles High Timing Window, increasing negative divergence and $40 oil which we have been discussing for months. See a clip from the Daily Update below:
Crude Oil May 26th:
The results are a decisive break of the trendline and a nice profit for our subscribers. We expect the decline in Oil to continue into our next low timing window.
Since last year we have been discussing Crude Oil turning lower. Bigger picture we have been discussing the Triangle into March 1st and how commercials were 2-1 short in Crude Oil. The compression in oil on March 1st was 44 days which is a historical first and not seen in the last 20 years. We expected a thrust out of the triangle and back test into the triangle and now the finishing move lower.
You can listen to all the fundamental news you want but commodity markets are “traded”. Analysts base their forecasts on supply and demand which is one important consideration. We look at commercial traders and how they are positioned in the markets, we look at market timing cycles integrated with Elliott Wave which gives insight into market psychology and we look at the price patterns and Fibonacci’s price levels which help us forecast market direction. By integrating multiple disciplines we provide our subscribers with insights and actionable forecasts.
Need help in trading the volatile energy markets? The Daily Update service helps you with forecasts and timely updates for Crude Oil and Natural Gas, as well as Indexes, Bonds, Precious Metals and other commodities. Learn more by Clicking Here.
 27th May 2017