The Options Trading and Investing service provides perspective on high quality setups and option trading strategies. We carefully select these setups due to their quality and profit potential and we report back on results. In the weekend free webinar I review current portfolio performance and I also discuss techniques that I utilize to help reduce risk and, in some instances, lock in profits from previous trades. This week I discuss adding a Ratio Spread to the EEM position and preview a new potential position in RUT. Finally, I update the Apple stock vs. Apple option ‘competition’ to see which strategy is performing best.
Please refer to our education video HERE for more information in the option strategies used in this post.
The entries and cost basis of new positions will appear on our private twitter feed during the coming week.
Below is the breakdown of all option positions. 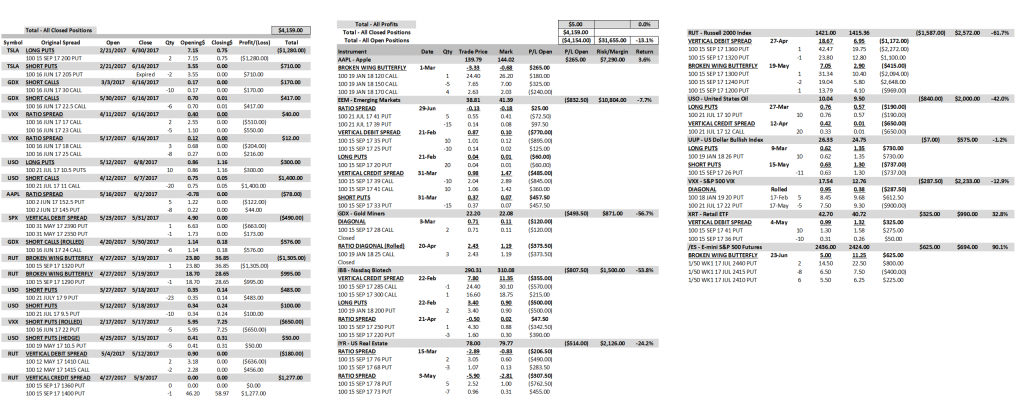
Current position in EEM is shown (below) after I added a Put Ratio Spread to the position this week. I bought 5 Jul21 EEM 41 puts and sold 15 Jul21 EEM 39 puts for a total cost of $65. As I mentioned in the previous slide the open loss on the position is $832.50. Now that Stan is projecting a turn in this price range for EEM I will get a little more aggressive to the downside. I would have preferred not to add any more upside risk in EEM since that is where my loss is occurring at present but since it is only $65 I allowed it. The potential payoff to the downside is many multiples of the upside risk from that adjustment. In fact, looking at the overall position it is possible to turn that loss into close to a $500 gain by Jul21 with a 5% move lower. Even just a 2% move lower will reduce the current loss by over $300. If EEM doesn’t decline over the next couple of weeks? I will continue to make aggressive downside plays until it does go down while only allowing small losses to the upside from those adjustments. If EEM is still in the same price area or just lightly lower next week I will look to add another short-term downside position that I will establish for a credit so I don’t take on any additional upside risk. 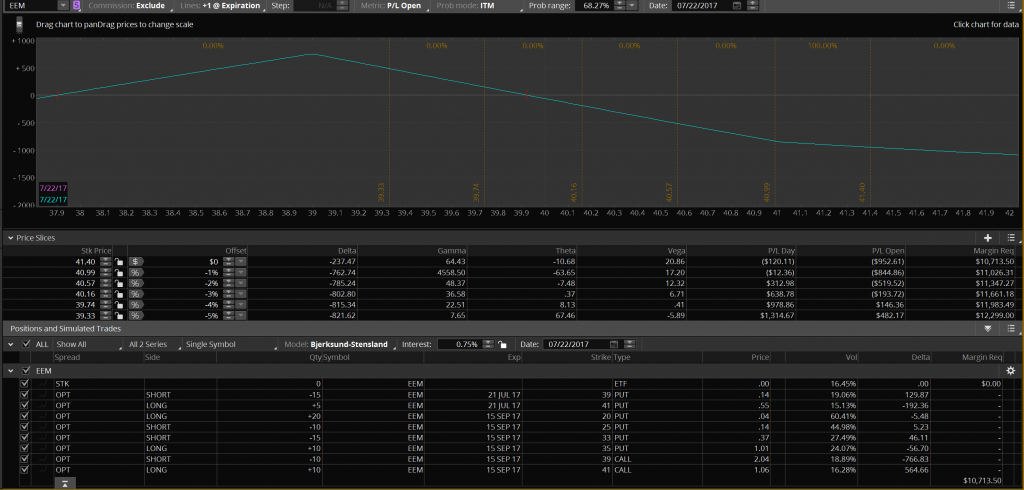
Let’s consider a move lower in the RUT into late summer followed by a move higher into the end of the year. You would have to place 2 trades to cover those moves right? Actually, you can capture both moves with one position. Below is an Unbalanced Broken Wing Butterfly (BWB). If you have seen some of the previous option videos you will recognize this position as one of my frequent positions. Here’s why; the position allows for a 2 sided move while accruing Theta the entire time. In this particular position you can see that the break even price at Dec15 expiry is just 2 points below the current price so I don’t need a big move lower to have a profitable outcome. If RUT does move lower for a few months or even all the way into expiry I will make at least a $4,000 profit if it closes below 1400 at Dec15. A $4,000 profit on a risk of $4,975 is an 80% return on risk for just over 5 months. The maximum potential return is 261% or a $13,000 profit. Do I have to accept a much lower probability of profit in order to make such a good return? Actually, the probability of making a profit on the trade is about 50%. There is approx. a 45% probability of making at least the 80% return on risk or a $4,000 profit on the position by expiry. You can see I am not giving up a high probability of success in order to make a really good return. Are there other positions that have at least a 50% probability of profit that pay really well? Let’s consider the standard at the money (ATM) vertical. 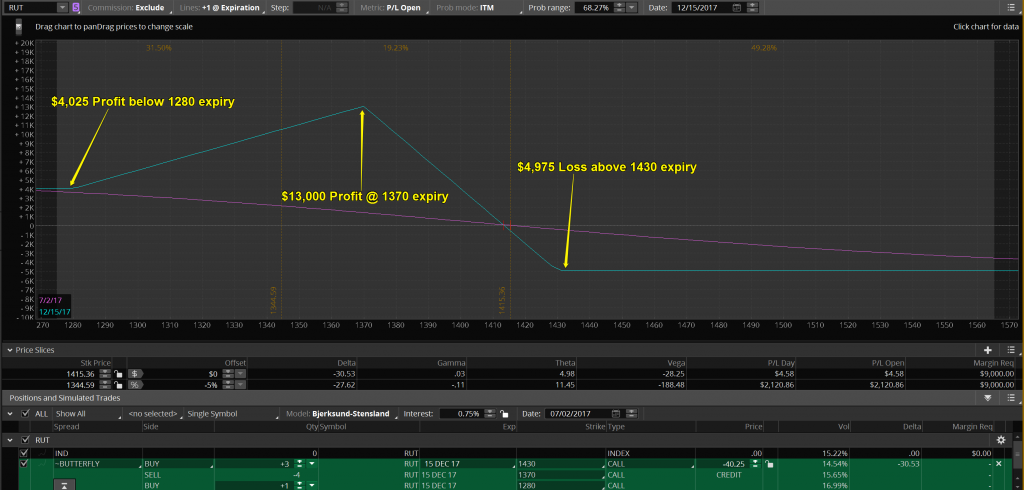
The profitable outcome on the previous slide was about 50%. In the risk profile below, the Put Vertical Debit Spread has almost the identical 50% probability of profit. The max loss is pretty close to the previous position and the max profit if RUT is below 1340 @ Dec15 expiry is considerably better. However, compare the profit a the -5% price slice. In the vertical spread the profit is $6,730. On the Unbalanced BWB, the profit if RUT is 5% lower as of Dec15 is $10,525. So when do I use a vertical spread and when do I use the BWB? That is dependent on Stan and Jack’s time a price targets as well as my other positions in the options portfolio. For instance, if I already have the price area on RUT below 1340 covered well where I will make a good profit from an existing position I might add the BWB to maximize profits from a smaller move lower. If I will already profit from a smaller move I may want to use the vertical to increase profitability on a bigger move. Managing an options portfolio isn’t about just adding a bunch of similar positions on top of each other. I want to cover a broad spectrum of time and price to maximize profitability of the overall portfolio. 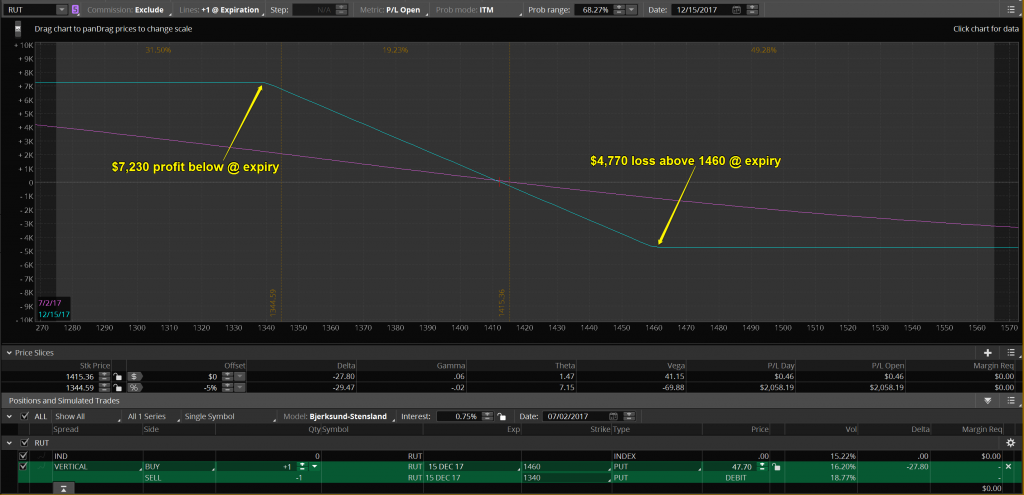
Some of you (I hope) may be asking why use a call BWB for a move lower instead of a put BWB. Aren’t puts designed for down moves and calls for up moves? In an efficient market, put spreads and call spreads can be interchanged without costing you any extra. However, keep following along here as I will soon mention one major difference to be aware of. If the bid/ask spread is comparable (as it should be) you can be indifferent as to whether you use the calls or the puts on this RUT position. RUT options are European style which means they can’t be exercised prior to expiry and they are cash settled so you can never end up long or short stock. On equities, such as my current position is AAPL that I will discuss in a minute, any short option can be exercised at any time. In general, you will find that if you are short in-the-money (ITM) call options you are more likely to have them exercised early than puts. Why? Dividends! When a stock is about to go ex-dividend and you are short ITM calls you are at a greater risk of finding yourself short the stock on the morning of the dividend. If that happens, you pay the dividend! That usually only happens if the extrinsic value of the call is less than the dividend. However, that is not guaranteed! A quick shortcut to estimating whether or not you will be assigned on a short call is to look at the price of the put with the same strike and expiry. If that price exceeds the dividend you probably won’t get assigned but again, no guarantees!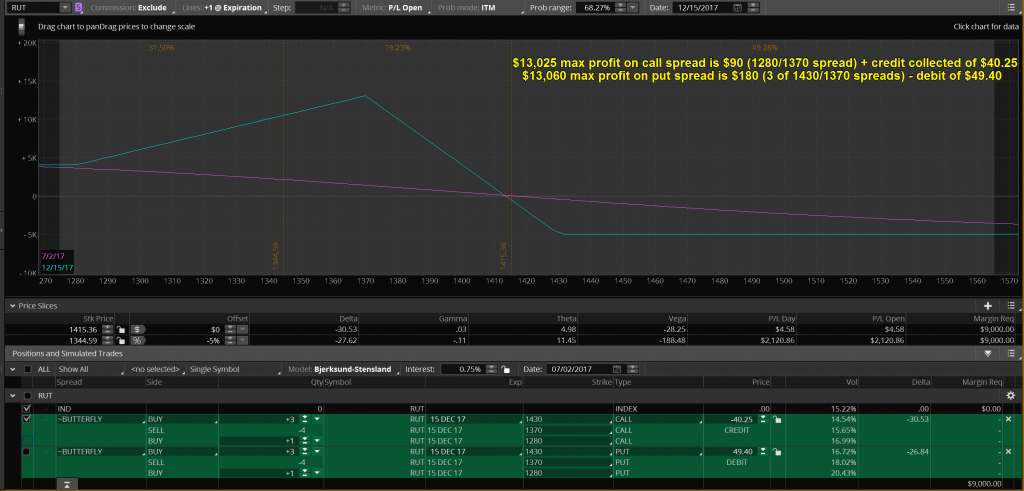
Below is the current position in AAPL. It is a long-term Stock Replacement Strategy that deserves a place in any of my option portfolios. Why do I call it a stock replacement strategy? What advantages does it have over simply buying the stock? As you can see below, the position is profitable as long as AAPL’s price is below $158.34. There is no risk to the downside. That feature is not available if you purchase the stock. This position doesn’t benefit from a large, immediate move higher like owning the stock does. That has been the big advantage to owning the stock over the past year. Will that continue? Stan doesn’t project that to continue in the Big Five Chart Service view of AAPL. If you are not a subscriber consider the 30 day free trial to see where he and Jack think AAPL (as well as NFLX, AMZN, FB, TSLA) is headed over the next year.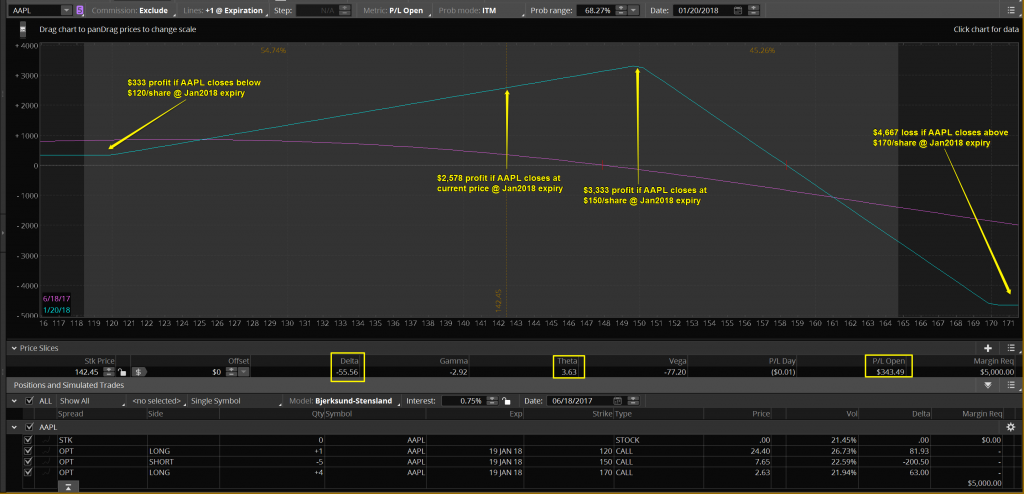
On June 11th I began keeping an updated comparison of how this strategy has performed in comparison with owning the stock so we can all see how it is working. As of the close on Friday 6/23/2017: The option position I established used up $5,000 of margin. For that amount of margin, I could have instead bought 72 shares of AAPL stock at $139.79 on 3/1/2017. On 6/30/2017, AAPL closed at $144.02/share. If I had bought the stock my profit would be $304.56. The option position currently has a gain of $265.00. That means that the option position has under-performed the stock purchase by $39.56.
This was the question I asked on the June 11 webinar when the stock position was out performing the option position by $918.68: If I was allowed to switch positions and take the stock position and the open profit but I had to hold whatever position I owned through Jan2018 expiry, would I make the switch? My answer? Not a chance! As we get closer to Jan2018 it will become obvious if I made the right decision.
What if the price of AAPL on Jan19, 2018 is the same as the current price ($144.02/share), what will the stock and options positions be worth then? The stock will still maintain it’s current $304.56 gain plus accrue $136.08 in dividends for a total stock profit of $440.64. The option position will have a total option profit of $2,732. The option position will out-perform the stock position by $2,291.36 by Jan 19, 2018 if AAPL’s share price is the same as the current price. 
Consider the AAPL position I just discussed. I established the position when AAPL was trading at $139.79 on 3/1/2017. To be profitable, AAPL could trade higher or lower or unchanged but the area where the position would lose at expiry was above $158.34. The area where the trade would be unprofitable immediately after the position was established was any price higher. In other words, the position was short-term bearish and long-term neutral to bullish. So what happened after I established the position? Of course the stock moved against the position and traded as high as $156.65 on 5/15/2017. Any bearish to neutral short-term (less than 60 days) strategy gets blown up and takes a loss as it expires. With this position I was able to ride out the storm and keep the position which has now turned profitable.
So what about the short-term traders? You can still be a short-term option trader and utilize longer-term option positions. Let’s look at the week of 6/12 – 6/16 in AAPL with the Jan2018 position that I own in the portfolio. Let’s say I felt AAPL was going to have a bad week and I wanted to take advantage of that. What if I didn’t already own my current position and I initiated it just before the close on Friday, 6/9/2017. So the stock drops by 4.5% but the option position would have had a $600 profit in one week which is a 12% profit on $5,000 margin requirement. If I was a short-term trader I could have closed the position 6/16 and booked the $600 profit. Now, if I knew that AAPL was going lower that week I could certainly have used a much more profitable short-term strategy instead but the problem is nobody knew what the price of AAPL was going to do last week. Stan estimates that good chart patterns play out about 70% of the time which is a huge advantage in trading however no one should take that to mean 100% certainty! Art of Chart option trading is about maximizing the range of profitability that you can get with longer-term positions while incorporating Stan and Jack’s price and time targets to reduce the cost basis of entering the positions. This method will produce slower profits but fewer losses and, over time, more consistent profitability with lower trading costs.
That is all for this week. If you have questions or comments you can post them here on the blog or if you are an Art of Chart subscriber you can post it on the private Twitter feed. If you are not a subscriber you can sign up for a 30 day Free Trial to try out the service. What have you got to lose, it’s free!
 02nd Jul 2017
Why is the emini futures position still open? I saw a post to close it.
Ed, I tweeted at 10pm on 6/28 that I would close the position for a $100 profit on the expected pullback in the /ES. Overnight the /ES started to fall strongly and at 9am on 6/29 I followed up with the tweet “Alternative to closing the /ES option trade by adjusting position at 50 back today. Take all risk out and keep $1,500 potential”. I attached a full description of that alternative with risk profiles to help explain the alternative. Then, 1 hour later I tweeted “The 2430/2440 call spread is offered @ $5.00 so I can remove all risk from /ES position. I’m holding for now.” That change in strategy was based on the price action in /ES on 6/29 (/ES didn’t bounce off the 50 back level and was down over 40 points from 6/28 high to 6/29 low.) Since /ES appeared to be choosing the bearish route forward in the short-term I decided to hold the position. When I tweet out my trade thoughts I realize that some people won’t see all of my tweets so there could be some confusion. If you search for #optionsAOC on Twitter and sort by ‘Latest’ you will see all of my tweets in chronological order. In short-term positions I rely heavily on Stan and Jack’s take on the market. If they see an important support level (50 back) broken they will usually change their projection for the short-term price movement and so I will usually change also at that point. With today’s rally the position is back to where it has a $100 profit. If you wanted to re-establish it you could. If I was establishing a new position here I might consider adding some time to the new position. Let me know if you have follow-up questions.
Thank you. Any plans to put the December RUT butterfly trade discussed in the weeks update?
Ed, because the portfolio is already quite bearish, I would like to see confirmation of a downside move in RUT before entering that position. Stan will comment on that in the daily updates but basically letting the first move lower happen without initiating the position. Looking for first move to go below important pivot (weekly or monthly) and then look to enter the position on a retest (from below) and rejection of the pivot point. That typically precedes the bigger move down and avoids initiating bearish position on an underlying instrument that keeps grinding higher.
Just added to /ES bearish position with a put vertical debit spread. See #optionsAOC.
I was notified that I was assigned the VXX 21July 22 Put. Can u explain that one. I understand being assigned calls. Guess I thot assignment of puts if ITM by expiration would then be assigned.
Marcie, First off you should understand that any time you are short any option, put or call, you can be assigned at any time. Having said that, typically you won’t be assigned as long as the option you are short has at least some extrinsic value. In the case of short calls on dividend paying equities, the extrinsic value should exceed the dividend amount on the ex-dividend date or it is likely you will be assigned (see Sunday’s blog post/video on shortcut to estimate likelihood of assignment). In this case, you are short puts (22 strike Jul21 expiry) that have no extrinsic value. That is because they are so deep in-the-money (ITM) with so little time left. Being assigned on those puts means that you are now long shares of VXX at a cost of $22/share. With VXX trading at $12.90/share that doesn’t look too good however, at the time VXX is assigned and you own the shares, the puts that you sold are closed out and you realize the full profit from selling them. If you sold them for $7.50 like I did, you realized a $750 profit per 1 contract sold. So now you actually own VXX at $22/share minus $7.50/share or a net down cost of $14.50/share. The other side of the equation is you own, if you did the position that I did, the Jan2019 puts at the 20 strike. I paid $8.45/share for mine. Assuming the same price for you, that would give you the right to sell your VXX shares that you now own for a net down price of $11.55/share. So, the net cost of your VXX shares is $14.50/share and you are guaranteed that you could sell them for at least $11.55/share anytime prior Jan2019. Assuming you keep the shares, you could begin selling calls against the shares that you own to reduce your cost basis below the $14.50/share. If, over time, you sell a total of $3 in calls without having the stock called away your net down cost would then be below what you could sell them for guaranteeing a profit. Remember, you have 18 months of put protection on the stock because you own Jan2019 puts so you could conceivably sell many months of calls to reduce your cost basis! If you believe that the S&P 500 is heading lower over the next few months then you could hang onto the shares and then either sell them when you think the decline in the S&P (and rise in VXX) is over or you could sell calls on the shares at that time collecting more premium. If you didn’t want to keep the shares for cash (or other) reasons now but you still believe the market is going lower (and VXX higher) then you could sell the shares and then also sell some new ITM puts further out in time that have a decent amount of extrinsic value. For instance, the Sep15 puts in the 18-22 strike range show about $.30-$.50 of extrinsic value. As VXX rises in price those can be bought back at a lower price making a profit.
Hopefully my explanation hasn’t been too confusing. If you have further questions please don’t hesitate to follow up with additional questions or comments. This is a great learning experience and not something that is a really bad outcome. For my part I should have rolled the July puts out to September to get the extrinsic value back into the short puts. That can be done for a credit which just adds to the potential profit of the position as long as VXX rallies in price by a decent amount over the next couple of months. I think I will work on a blog post that covers this very issue because other people could benefit from it as well. Happy 4th!!!
Thanks Paul. I don’t see it as a bad thing. Just wanted to understand it better. Think I will write some calls on the VXX now. That trade wasn’t in my original plan but it works!
Actually I will wait to sell calls when the low window is done in the S&P
I like the idea of waiting based on Stan and Jack’s projections of a lower S&P. There is something you can do in the meantime if you would like to make some headway on the position. Just remember that what I am about to say is not trading advice or a recommendation! If it was me and I owned the stock I would look at adding a 1×2 Call Ratio Spread that I would add for a credit. For instance, I might buy 1 Sep15 VXX 14 Call for every 100 shares of VXX that I own. In the same transaction I would sell 2 Sep15 VXX 18 calls. That creates a 1×2 Ratio Spread and right now the mark shows as a $.10 credit. Because you own the shares you are not uncovered which means even if VXX explodes higher the 2 short calls are ‘covered’ by the 1 long call + the 100 shares. The $.10 credit reduces your current cost basis by $.10 (big deal) but the point is it isn’t adding to your cost basis. The potential benefit however if VXX is at say $17/share at Sep15 expiry is you can sell your 100 shares (if you want to) for $17/share giving you a nice profit on those shares PLUS you would own 1 Call that would be worth $3/share (assuming you bought the 14 call). If you wanted more room to the upside you could consider the 15/19 or even the 15/20. That would allow for a big move higher in VXX to coincide with a big move lower in the market. It all depends on your market view. Either way, if you do the position for a credit you don’t add to a potential loss in your current VXX position. Then, if VXX goes higher into September (after expiry) and you still own the shares you could then sell calls against your long stock and bring in more premium. Just something to consider…
Paul,
A while back there was a SPX PUT butterfly for September expiration listed at +1 1300, -2 1240, +1 1200. I don’t see it listed now, was it closed? I am down over 1 K in it now. Any suggestions to help this trade out or leave it as it is? Would need a huge drop in SPX in a couple of months for this to be profitable. I am considering closing it until markets break support areas.
There is also a RUT butterfly listed that is underwater and way out of the money to become profitable. Why are these trades put on before the SPX and RUT have not broken through support?
Thanks Ed
Ed, I believe you have a SPX position mixed up with the RUT position. The portfolio currently holds a RUT Broken Wing Butterfly (BWB) with the strikes and quantities you listed in your question. That trade was initiated on 5/19 for a debit of $7.05. That means the maximum loss on the position is $705 so I am not sure how you have a $1,000 loss in the position. The current mark of the position is $2.75 so it is currently down $430 as of yesterday’s close. Stan is projecting RUT down to near 1300 by month end so, if that is the case, the position will be profitable at that point and I will seriously consider taking it off and/or replacing it with another position.
I want to note here that all of the positions I initiate or close are listed in the spreadsheet that I post at the top of every week’s blog and option’s video. Stan, Jack and I are completely transparent in our trades. You can go back and look at previous week’s blogs to see a complete list of the open and closed positions currently and from the past. Everything is there; the good, the bad and the ugly!
As to why any position is initiated before the underlying has broken through support, which support are you thinking about? Support can be found at trend lines, moving averages, Bollinger Bands, pivot points, previous resistance lines, previous lows, etc. Trading is hard because there are no magical support lines that, if broken, mean the underlying is going lower. In fact, many good long trades are initiated once support is broken and then reclaimed. Stan and Jack’s job is to project future price and time targets where there is likely to be a good trade location for the initiation of a new position. My job is to provide option positions that allow for the accrual of Theta and/or offer good reward/risk ratios at those good trade locations. If your trading style is to wait for ‘confirmed’ price movement instead of a more contrarian style, Stan always provides those price levels as well in his chart analysis.
As always, I appreciate your comments and questions!
Paul,
I believe my confusion may be the suggested trades that are put on verse actually trades. Major support to me would be more of where price reversed or broke out. I would consider 2400 on the SPX major support which was prior resistance. Price action tends to run in channels and the RUT has basically bounced between 1330 and 1430 for a number of months so I would expect a large break down on a close below 1330. On the other hand buying the butterflys near 1430 could also work for a better entry if it does not break above resistance with a reversal candle and then comes back down. It also seem like closing a trade early like TSLA when it broke above resistance would have been prudent and then putting on a bearish position when there was a divergent top and then broke below the wedge. I was wondering why you hold onto position so long when they go against the trade, similar to the short term es trade last week. It would also be helpful to stick with the indexes rather then the futures. I am not able to trade options with futures. I can trade their contracts but not options. I was able to put on multiple July, August bearish butterflys on TSLA on the cheap. We’ll see what happens near expiration. Thanks for all your ideas given and how the market can be traded with less risk and higher reward. To me it is difficult to predict the markets months in advance without the market showing it’s hand. Hopefully Stan is correct along with a few other folks I follow and we get the large drop end of July till September and these long term positions. I’ll probably add these types of trades near resistance again on reversal candles with divergence and when they break below a support area with conviction probably with put debit spreads.
Good stuff Ed! You’ve obviously put a lot of thought into this. My strategy for options has developed over many years and fits my style of trading. I very seldom take a losing trade off early unless it is extremely far out of the money. I use longer duration and lower risk/reward positions to increase my potential for profit. In today’s webinar I discussed the EEM position where I have been down for 4 months but I’m in a position now where I can eliminate the entire loss (or turn a profit) in the next 2 weeks on a relatively small move lower. By not taking off the losing September position I am providing ‘cover’ for a more aggressive short-term bearish strategy. If EEM just hangs around the current price or perhaps drifts lower this week I might add another, even more, aggressive position that has no upside risk but can add downside profits. That way I can have losing positions actually benefit the portfolio instead of dragging it down. It does require a lot of patience though. Anyways, let’s see what I can do with EEM before the September options expire. It is really important to build as much Theta into an options portfolio as possible. Direction is the hardest thing to predict whereas the passage of time is the easiest thing to predict. You want to get paid for that as much as possible.
I’m sorry to hear there has been some confusion between actual trades that I have placed and positions that I have discussed but not placed. This is an educational service and not an advisory service so I am presenting positions that traders can study and learn from to decide if they make sense for their own portfolio. It is sometimes difficult to distinguish between the two. I appreciate your feedback and will attempt to be as clear as possible in the future.
If you watched the daily update tonight, what do you think about an SPX position similar to the /ES BWB I closed on Friday? How would you structure it?
In addition breaking below the 2400 support area on the SPX, also breaks a bearish wedge pattern on the weekly chart with divergence on the macd, rsi5, rsi14 and cci.