Paragon Options is a service that focuses exclusively on futures options. By doing so we are taking advantage of superior premiums compared to stock options and asset diversification offered by futures. Paragon Options is a directional options service that will focus on Metals, Energies, Bonds, Currencies, and Commodities. This service will launch on June 25th. Sign up now for our 25% pre-launch special discount on our annual and monthly subscriptions by clicking this link.
A Low Risk / High Reward Natural Gas Trade
On the bigger picture chart Natural Gas has been in a retracement since the December 2016 high, most likely forming a bull flag pattern for the next leg higher. Stan considers that this bull flag sequence structure has one more lower low to do, with a target in the 2.40 area, slightly under the 61.8% fib retrace target at 2.48.
NG should be turning down towards that last low now, with a weekly RSI 5 sell signal brewing and the target at 2.40 just under the strong support/resistance range 2.47 to 2.57, with eight highs and lows in that range since the start of 2015.
This is my NG 120min chart from the morning of the 22nd May, with NG in the last sequence higher. We decided to put on our first leg on this trade here while the last bullish pattern sequence was forming. This later resolved into a triangle which broke up into the final high and has now likely broken down.
Natural gas futures options 1×10 ratio spread
As per the above analysis we are looking for a sizeable drop into the 240 region in natural gas. This is a live trade and was opened on the 22nd May 2018. The underlying August future was trading at 2.971 at the inception of the trade. We had some concern that natural gas may go higher and so constructed our futures options position with that in mind.
The trade
The trade is a 1×10 ratio spread with the following legs:
-1 Jul/Aug 2.90 Puts
+10 Jul/Aug 2.60 Puts
This was established for a credit of -0.005
You will note that there are no short calls in the position as we didn’t want to have any upside risk should we be incorrect in our view. By using only puts we were able to create a position that had zero risk should natural gas go higher.
Structure
The structure of the trade is unique as you would not normally see a ratio spread in such a high ratio of 1 to 10. However, the volatility skew in natural gas futures options was such that it allowed this high ratio to be put on.
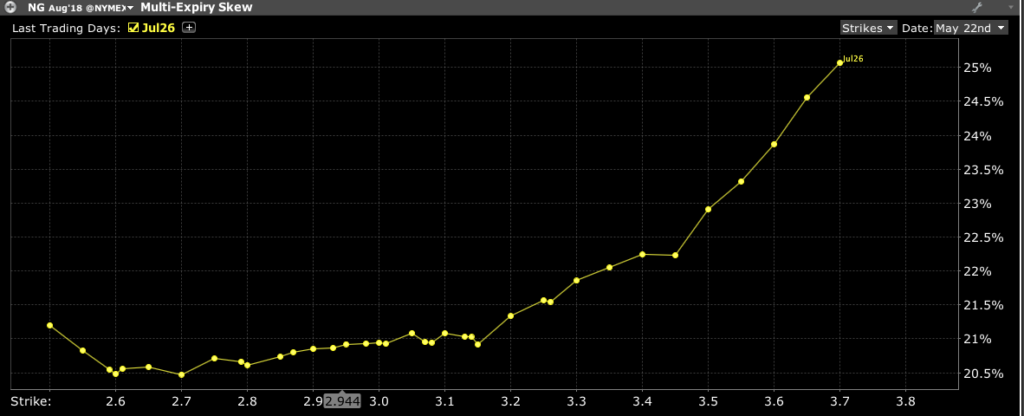
Here is the volatility skew
You can see from the graphic that the skew is very ‘bumpy’ and also that all of the skew is on the call side. Calls are very expensive relative to puts. You will also note that the 260 puts are the cheapest from an implied volatility viewpoint and that is one of the reasons that we selected this specific strike.
By selling just 1 of the 290 puts, we were able to purchase 10 of the 260 puts using only the credit received and so the net set up cost of the trade for us was zero.
Here is the P&L profile:
You will see the dotted line which is the trades current P&L profile. Should it reach our 240 target, the trade will return around $17,000. A huge return from a trade that we actually received $50 to set up. At expiry (the solid line) this futures options trade would return around $15,000.
The trade is structured in such a way that the 10 puts will counter any loss on the 290 put even as it moves into the money. The only real risk is of around $3,000 per lot should natural gas be at exactly 260 at the expiry. However, it should be noted that that risk will only materialise if we let our 260 puts expire worthless versus the 290 put and this is not something we would let happen. In reality, we would close out the 260 puts around a week or so before expiry and use that cash to close out the short 290 put. This way there should be almost no loss or only a very small loss on this futures options trade. Any rise in natural gas would result in a collection of the premium received at inception and has zero risk
Summary
This trade is currently worth -0.02 so we are slightly offside although we still have around 5 weeks of time remaining. Plenty of time for the trade to move our way. The August future is also above the 290 level so all things being equal at expiry this entire structure would expire worthless and we would collect the premium making a small profit on the trade.


 19th Jun 2018