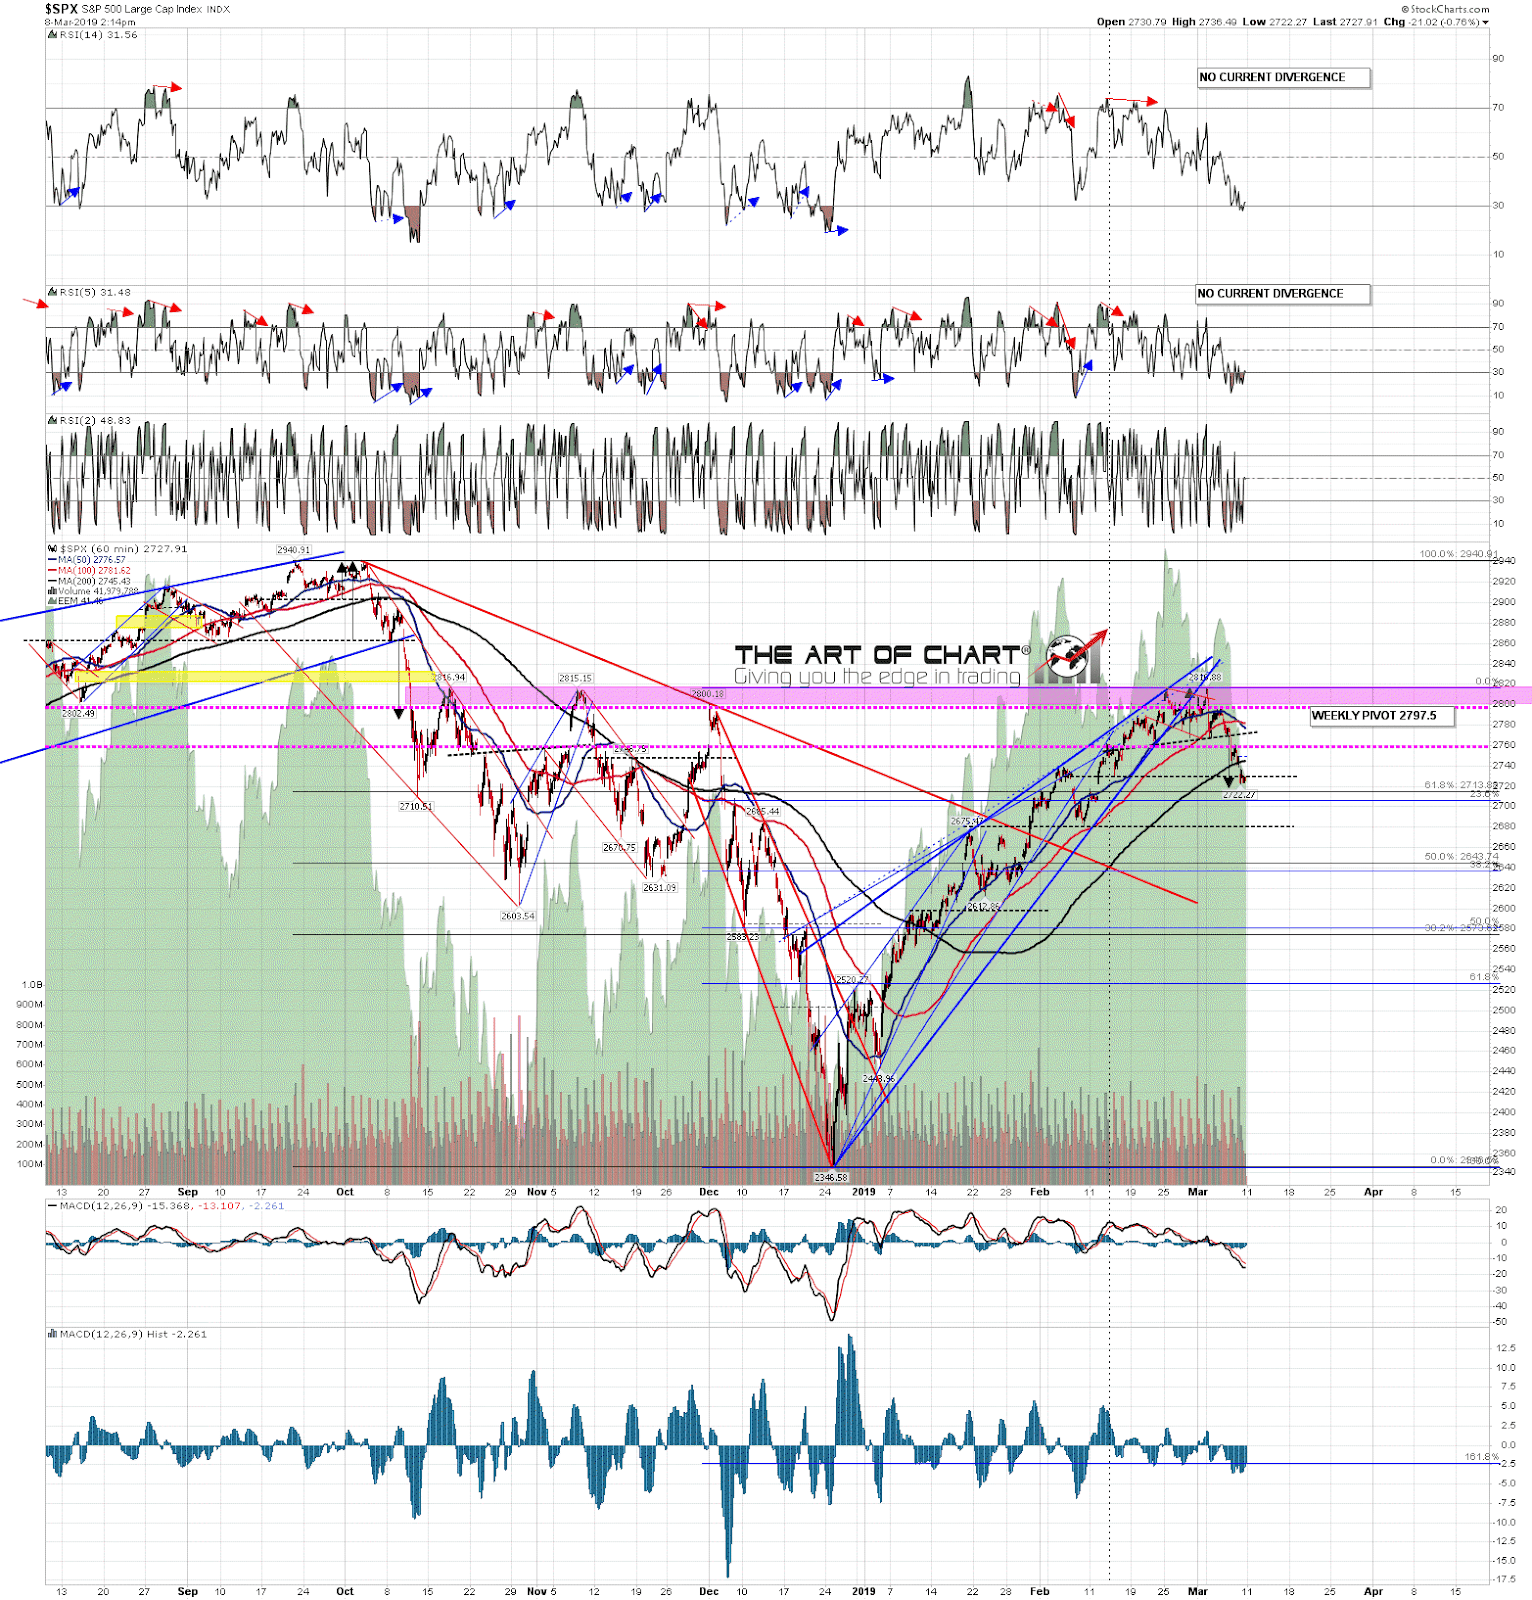
Everything that I was looking at on Wednesday has delivered except that SPX has not quite yet reached the H&S target at 2720. The daily RSI 5/NYMO sell signal fixed and reached target, the hourly sell signals on SPX and RUT both made target, and while SPX might need another marginal lower low to reached that 2720 target, this is the right area to see this retracement low, and it could already be in. So what now?
Well there are two obvious options here assuming that the retracement low is being made in this area. I’d expect either option to be complete within two weeks and for a larger decline to follow. My preferred option would be a retest of the rally high with a marginal higher high. My one reservation there is that the three highs resistance that I was looking at before the high was made never broke, with the current high at 2816.88 just 0.06 below the top of that resistance at 2816.94. That being the case there isn’t much room for a higher high unless that resistance breaks.
The other option here is that an H&S is forming, and that a right shoulder will form here with an ideal right shoulder high in the monthly pivot area at 2760. Depending on the time taken to rally, that might well be a decent match with the 5dma, currently in the 2766 area, and the 50 hour MA, currently at 2776. Either option should yield a reversal pattern that would take SPX back into the 2600-50 area.
SPX 60min chart:
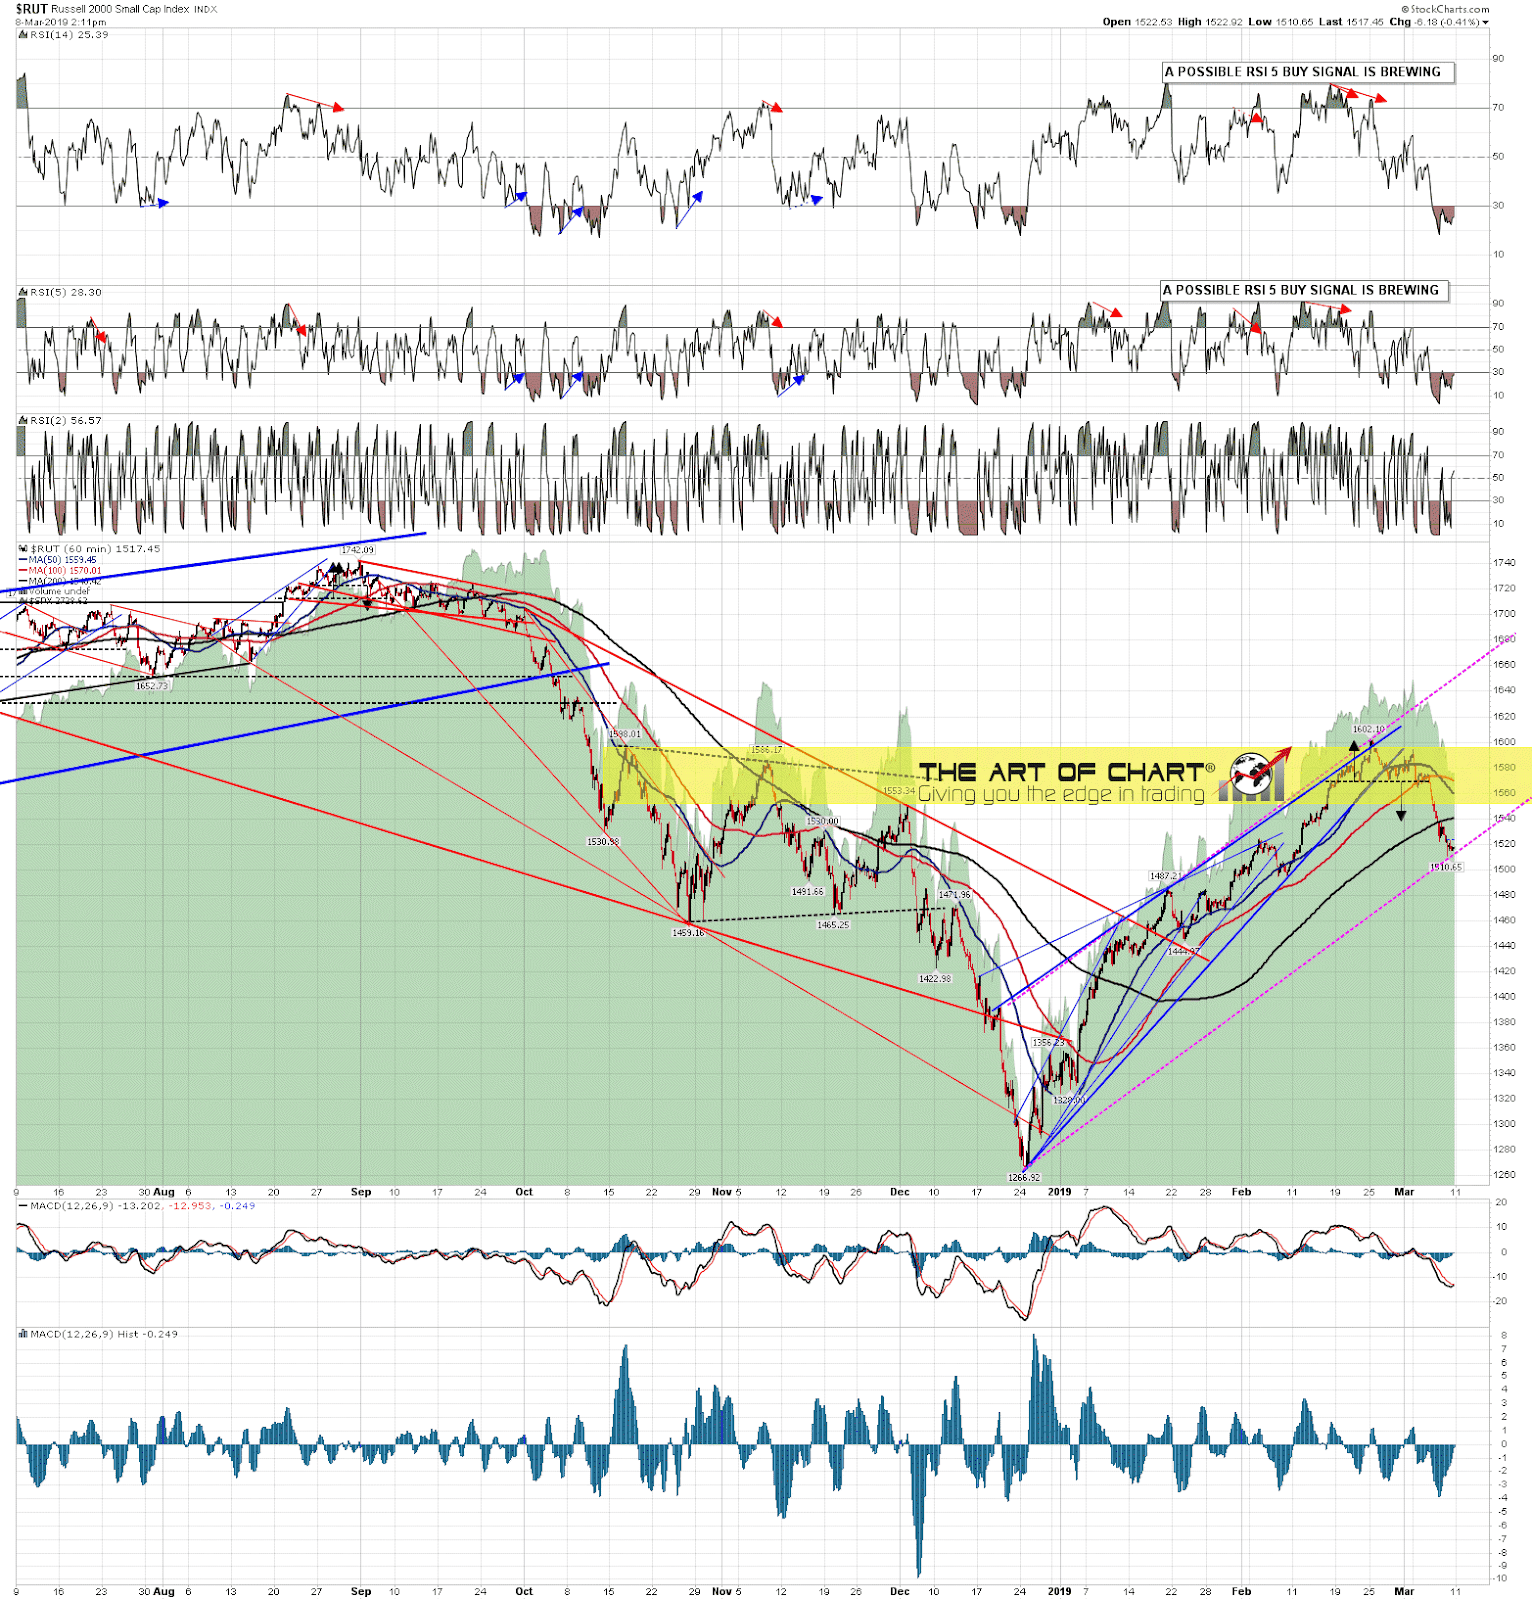
RUT has been leading the decline and may be leading on the rally as well. Worth noting that there are possible buy signals brewing on both RSI 14 and RSI 5, and that the current retracement low has established a decent quality rising channel that may be support on the next move up.
RUT 60min chart:
Everyone have a great weekend! 🙂
 08th Mar 2019