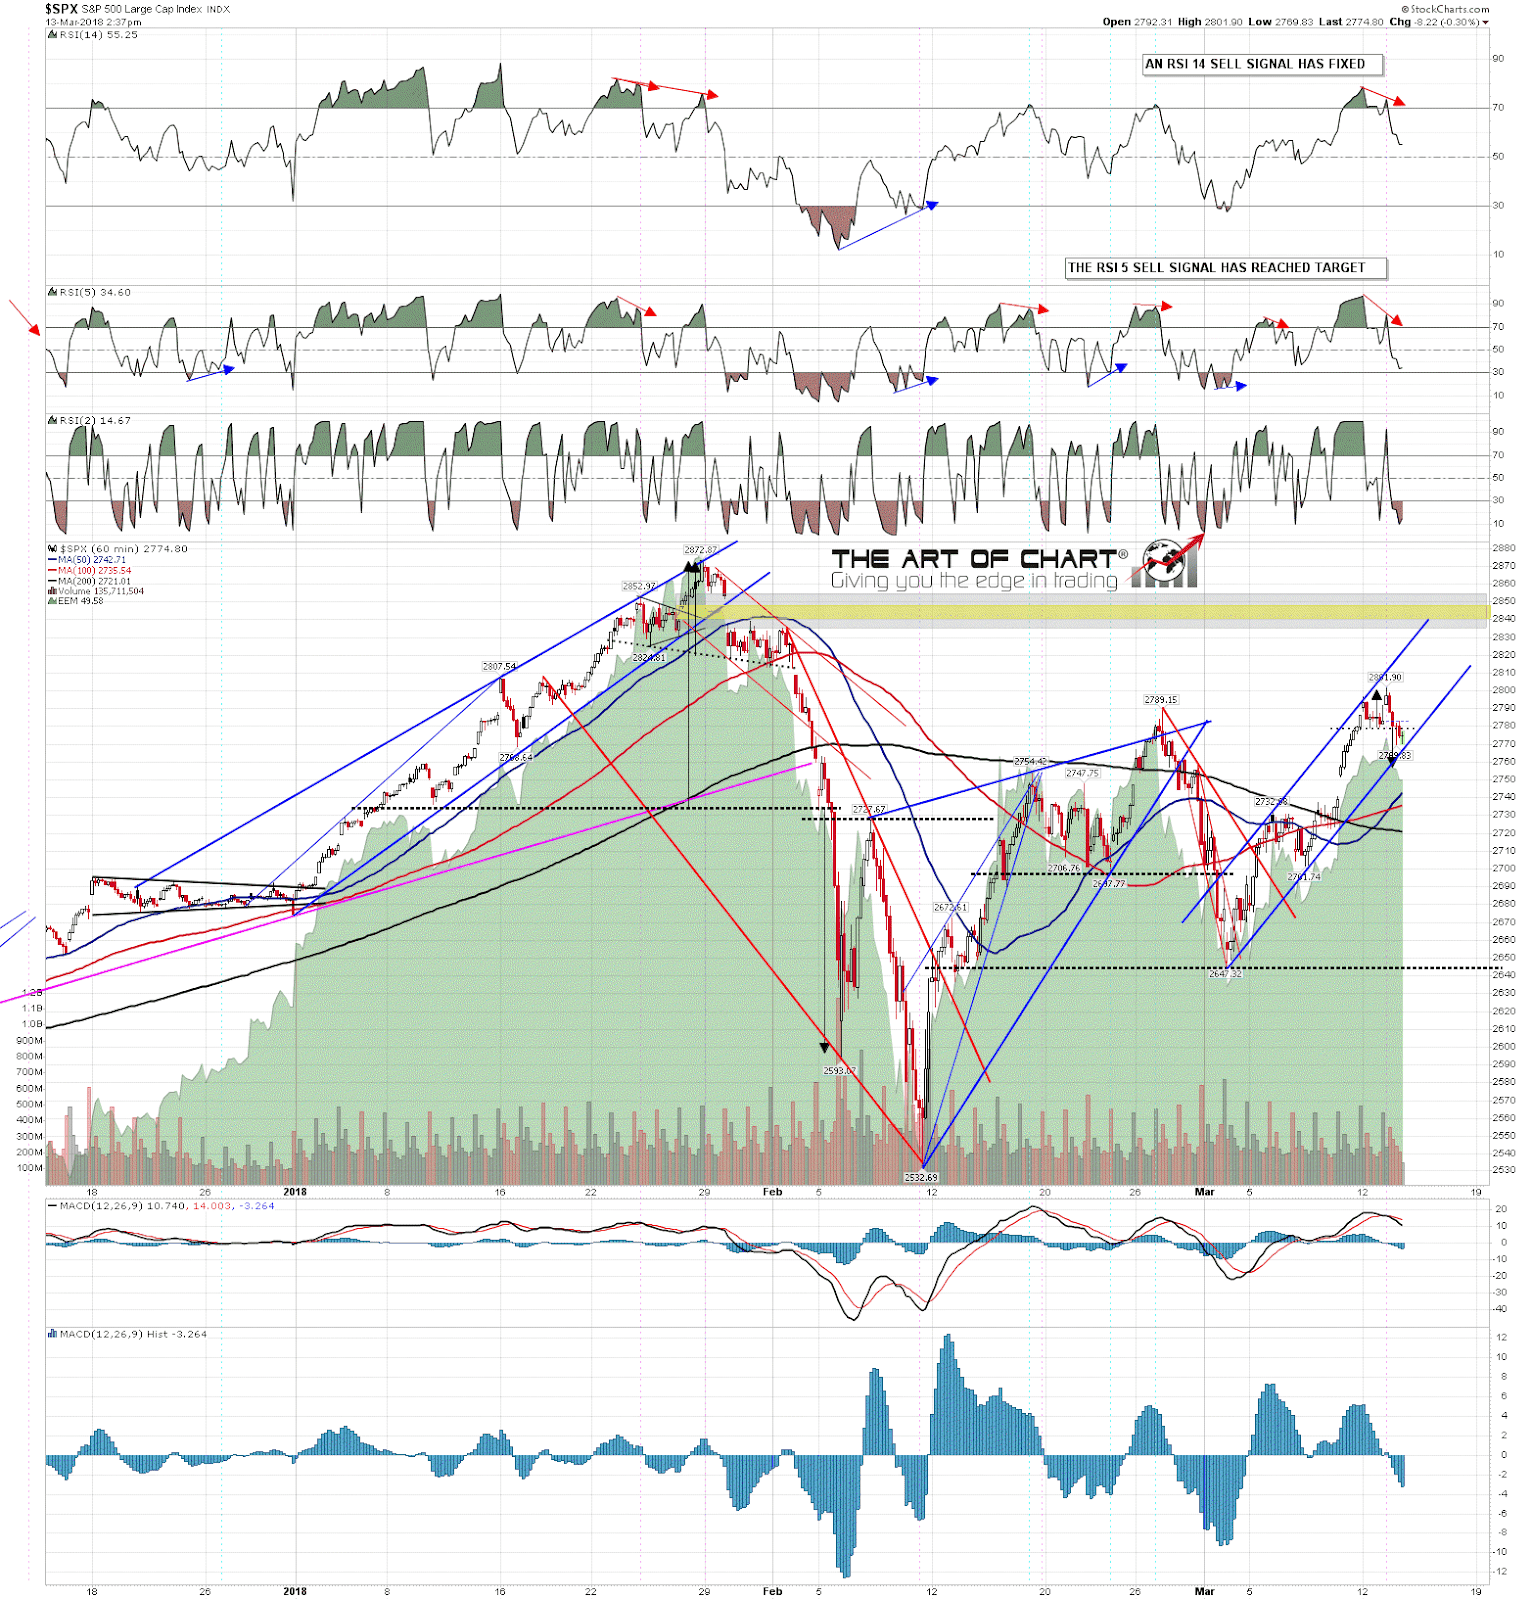
Stan and I were saying in the monthly free public Chart Chat on Sunday that the last day of the cycle high window was today and we were expecting to see a rally high made by the end of the day. You can see the recording of that here. There was obviously no doubt in our minds (wipes last of cold sweat from brow), and we should be putting in the first stage of that now. Hourly RSI 14 and RSI 5 sell signals fixed this morning on all of SPX, NDX and RUT, and except for RUT, the RSI 5 sell signals have reached target in this first push down. We are expecting more downside—likely a lot more downside.
I haven’t posted a full intraday video for a few days, so this is the full version also including DX, CL, NG, HG, GC, ZB, KC, SB, CC, ZW, EURUSD, GBPUSD, USDJPY, USDCAD, AUDUSD, & NZDUSD. I do a premarket video every day for subscribers, and a full intraday video most days, and Stan does a post-market video every night.
Intraday Video from theartofchart.net – Update on ES, NQ, and TF, DX, CL, NG, HG, GC, ZB, KC, SB, CC, ZW, EURUSD, GBPUSD, USDJPY, USDCAD, AUDUSD, & NZDUSD:
As I write with ES at 2770, SPX is starting to break rally channel support. On a break below I have a double top target on ES at 2760.50. Ideally, that would be hit today. SPX 60min chart:
 13th Mar 2018