SPX has spent the week inching through the topping process, with some progress particularly yesterday and today. Yet another higher high may be needed, as I was suggesting in my premarket video this morning. That is below with an update on ES and the usual 21 other futures charts.
Full Premarket Video from theartofchart.net – Updates on ES, NQ, RTY, DAX, ESTX50, SPX, NDX, RUT, CL, NG, GC, SI, HG, ZB, KC, SB, CC, ZW, ZC, ZS, DX, EURUSD, USDJPY, USDCAD, AUDUSD:
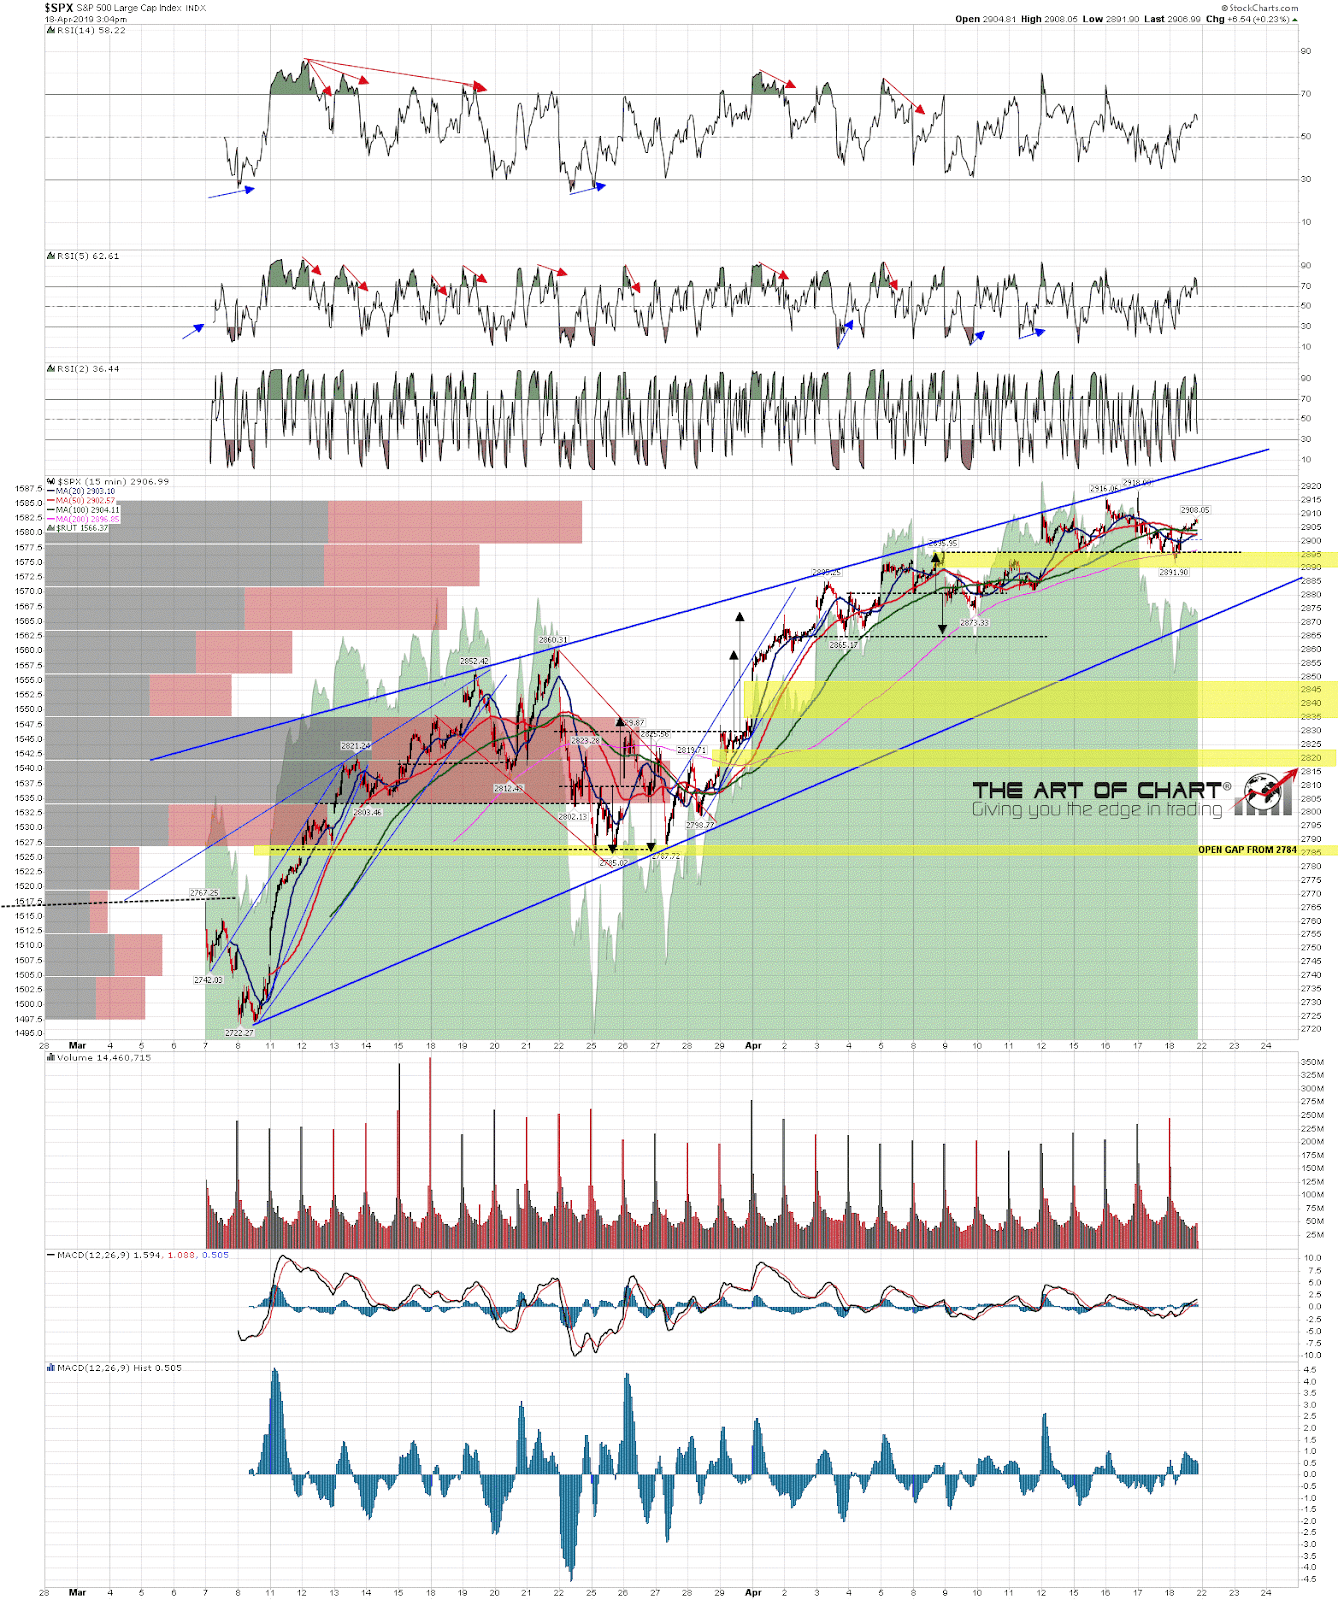
On the 15min chart the obvious next target would be wedge support, now in the 2871 area. Current support is the open gap from 2888.32, that has been tested today and yesterday and the next move may be to retest the highs to make a second high of a small double top before that open gap is filled to start the first decent move down. SPX 15min chart:
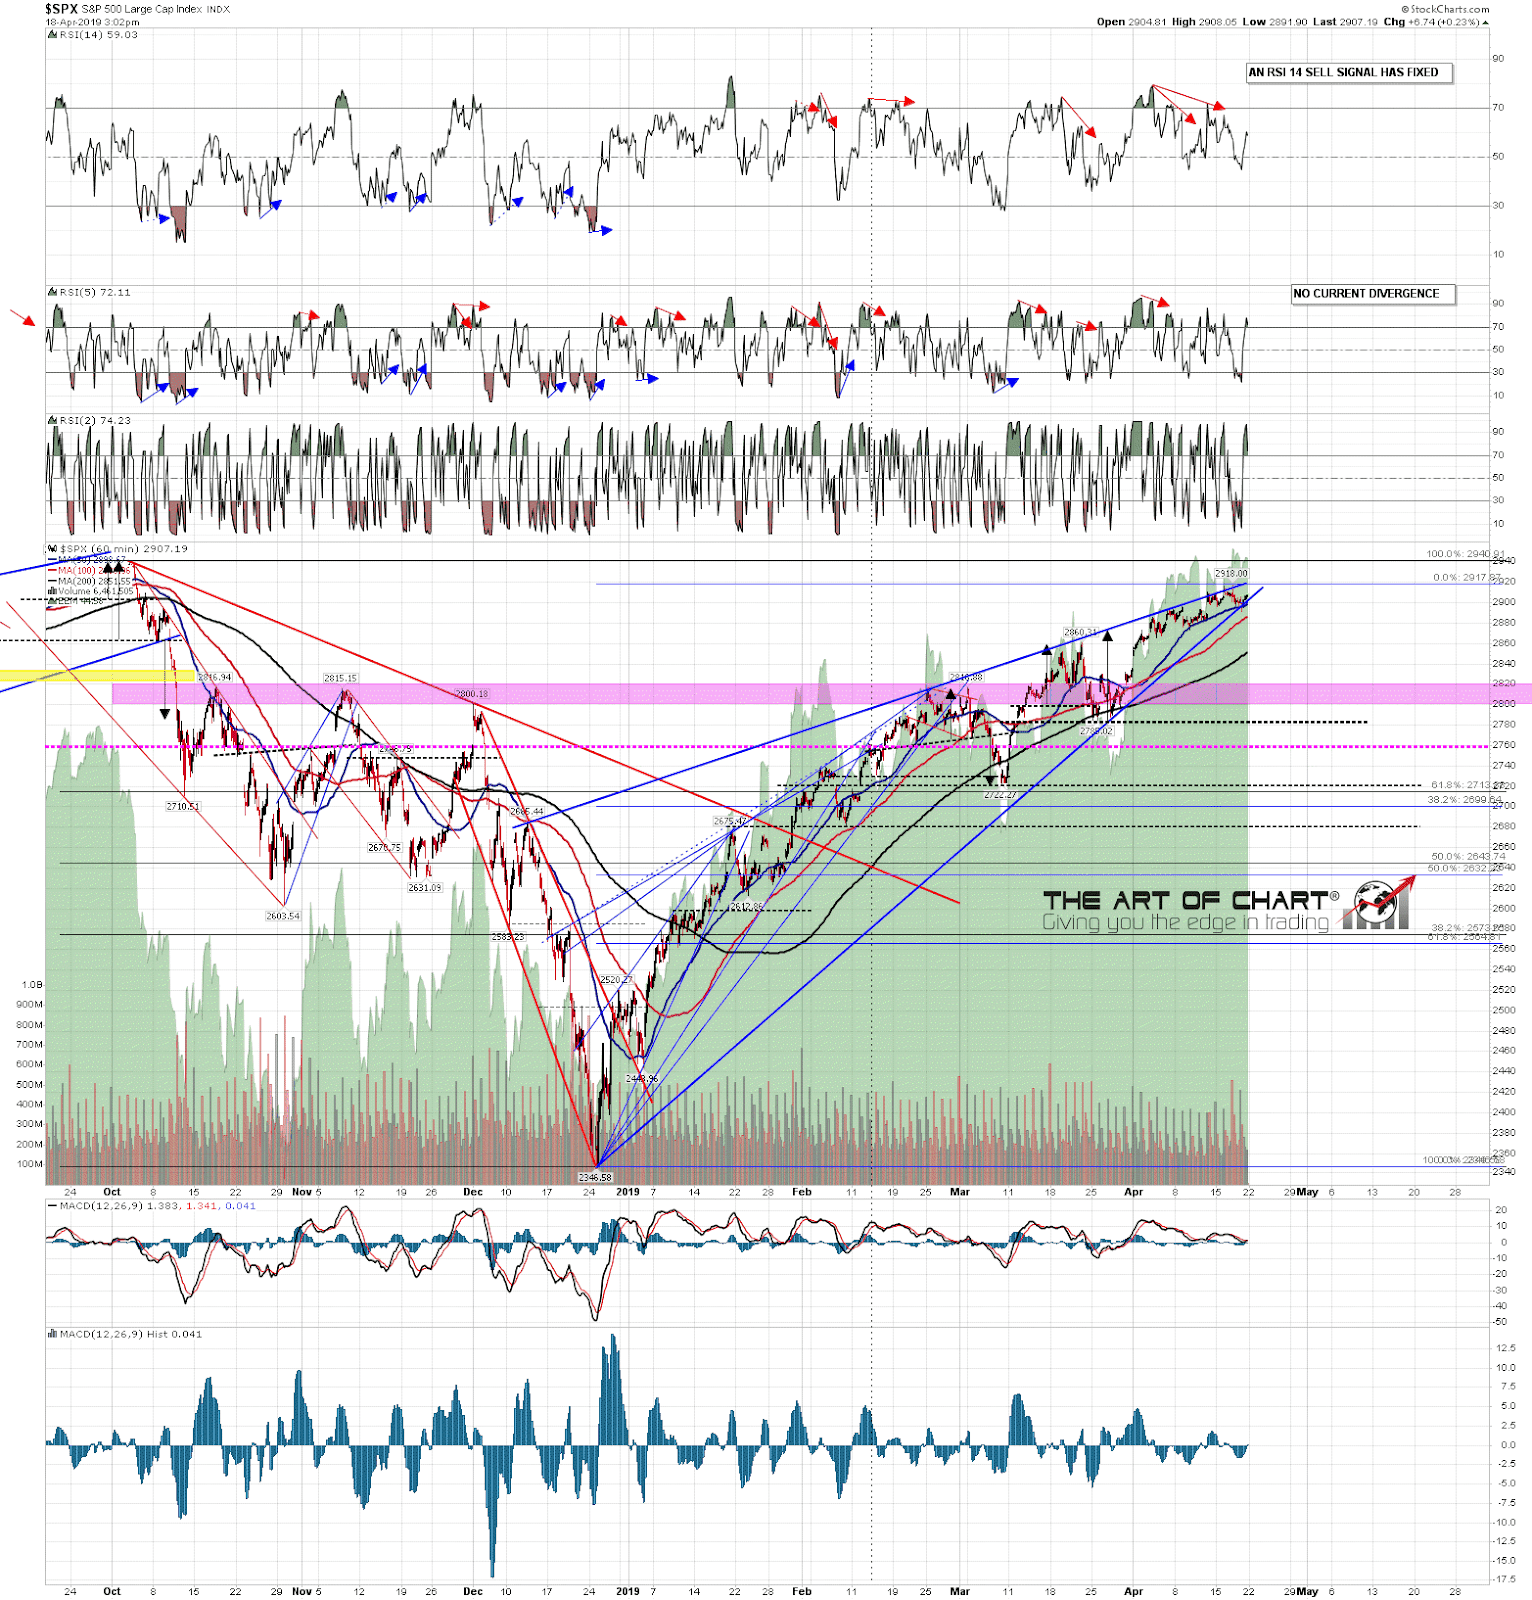
On the 60min chart there has been an RSI 14 sell signal fixed for a few days. If that was not already the case another would have fixed yesterday. The rising wedge from the December low has overthrown and then rising wedge support broke down slightly this morning. This should be at a late stage in the topping process. SPX 60min chart:
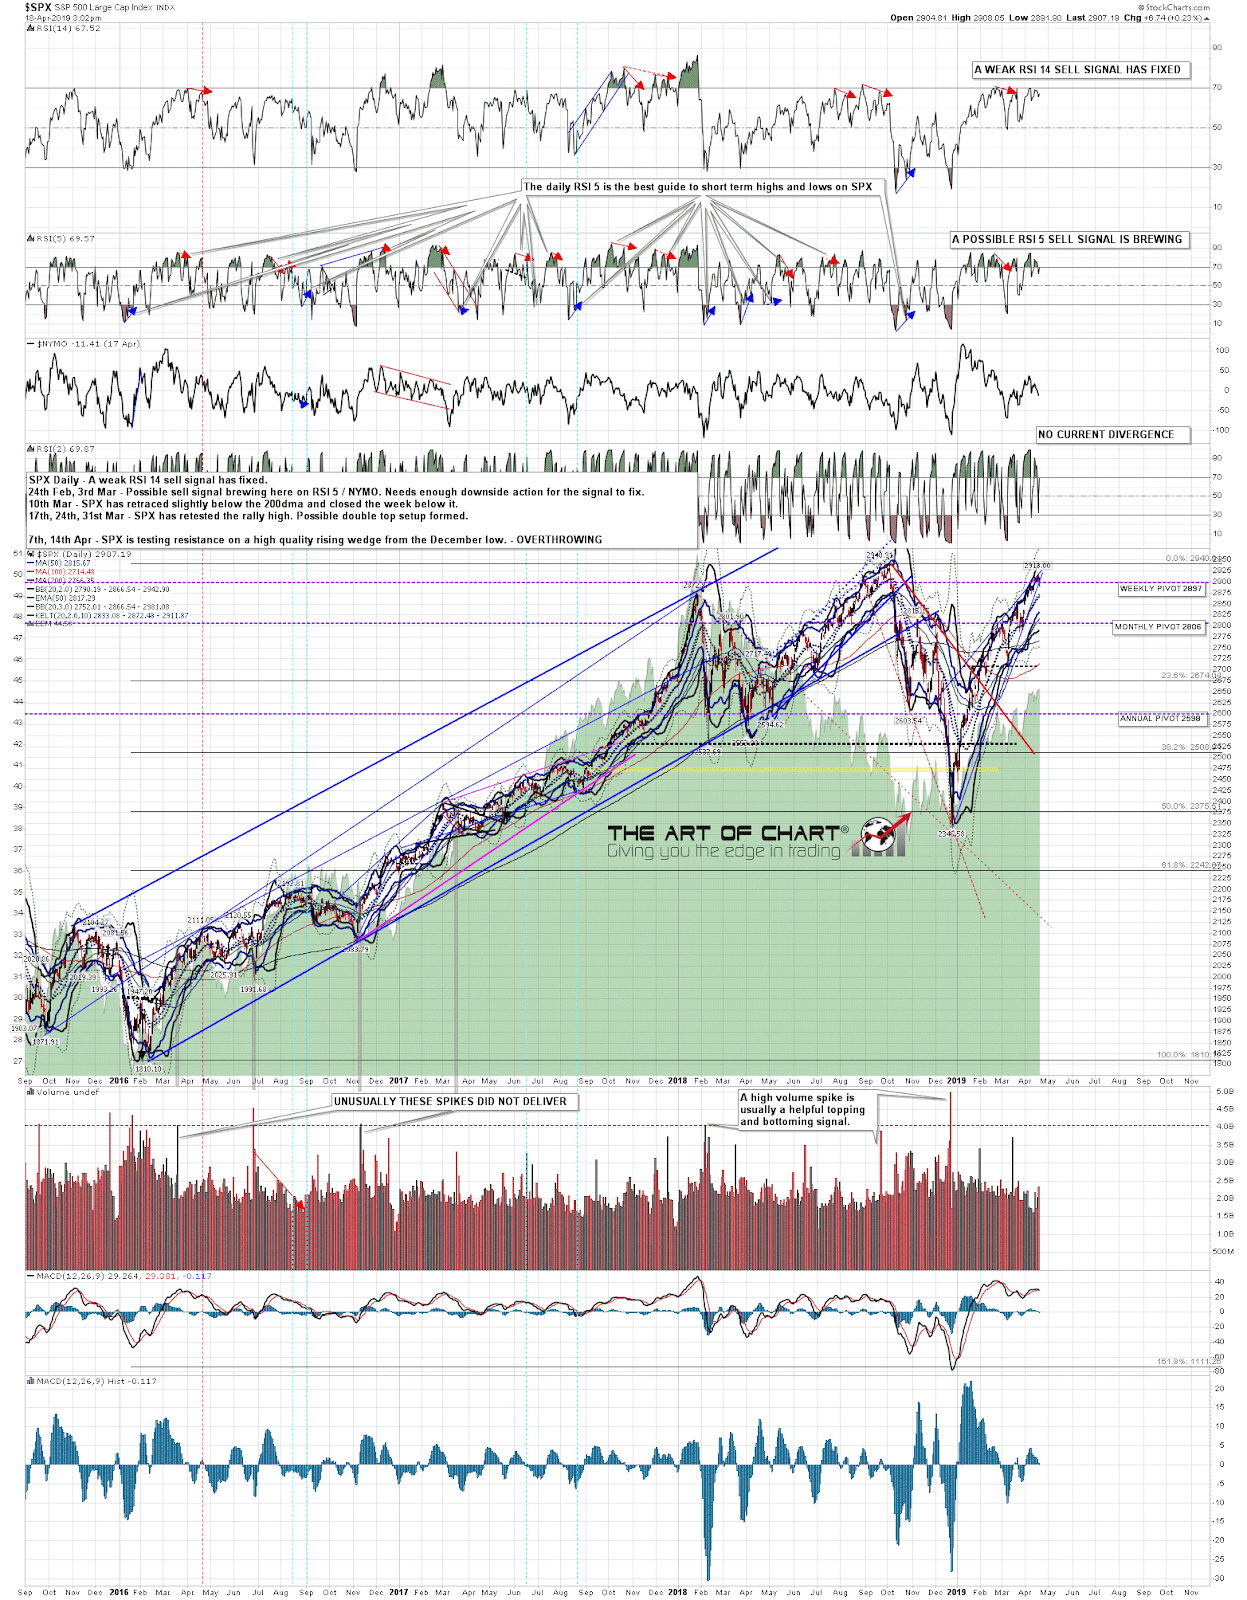
The daily RSI 5 sell signal on SPX that started brewing on the break to a higher high last Friday hasn’t yet fixed, but daily RSI 5 sell signals have now fixed on ES and RUT. More should fix soon. SPX daily chart:
One thing I would mention is that NDX made a new all time high this week. Has that increased the chance that SPX will make a new all time high before this next turn down? Yes, I think so, but that’s still not the most likely thing to see at the high in my opinion. We will no doubt see next week.
Stan and I are doing a free public webinar an hour after the close tonight on our big five and sectors service. We’ll be reviewing AAPL, AMZN, FB, GOOG, NFLX, TSLA, IBB, IYR, XLE, XLF, XLK and XRT. If you’d like to attend you can register for that on our April Free Webinars page.
Either way, everyone have a great holiday weekend! 🙂
 18th Apr 2019