
SPX broke back over the 5dma last Thursday and that put SPX back on the Three Day Rule, which is that after a decline of more than 2% followed by a break back over the 5dma, then SPX must hold above the 5dma the next two daily closes. If SPX fails to manage that then the retracement low (2801) should be retested before the initial high before the decline (all time high). The close on the third day on Monday was a clear break back below the 5dma. That low retest would normally be soon after the break and this a very strong stat, so I am looking for that 2801 retest.
SPX daily 5dma:
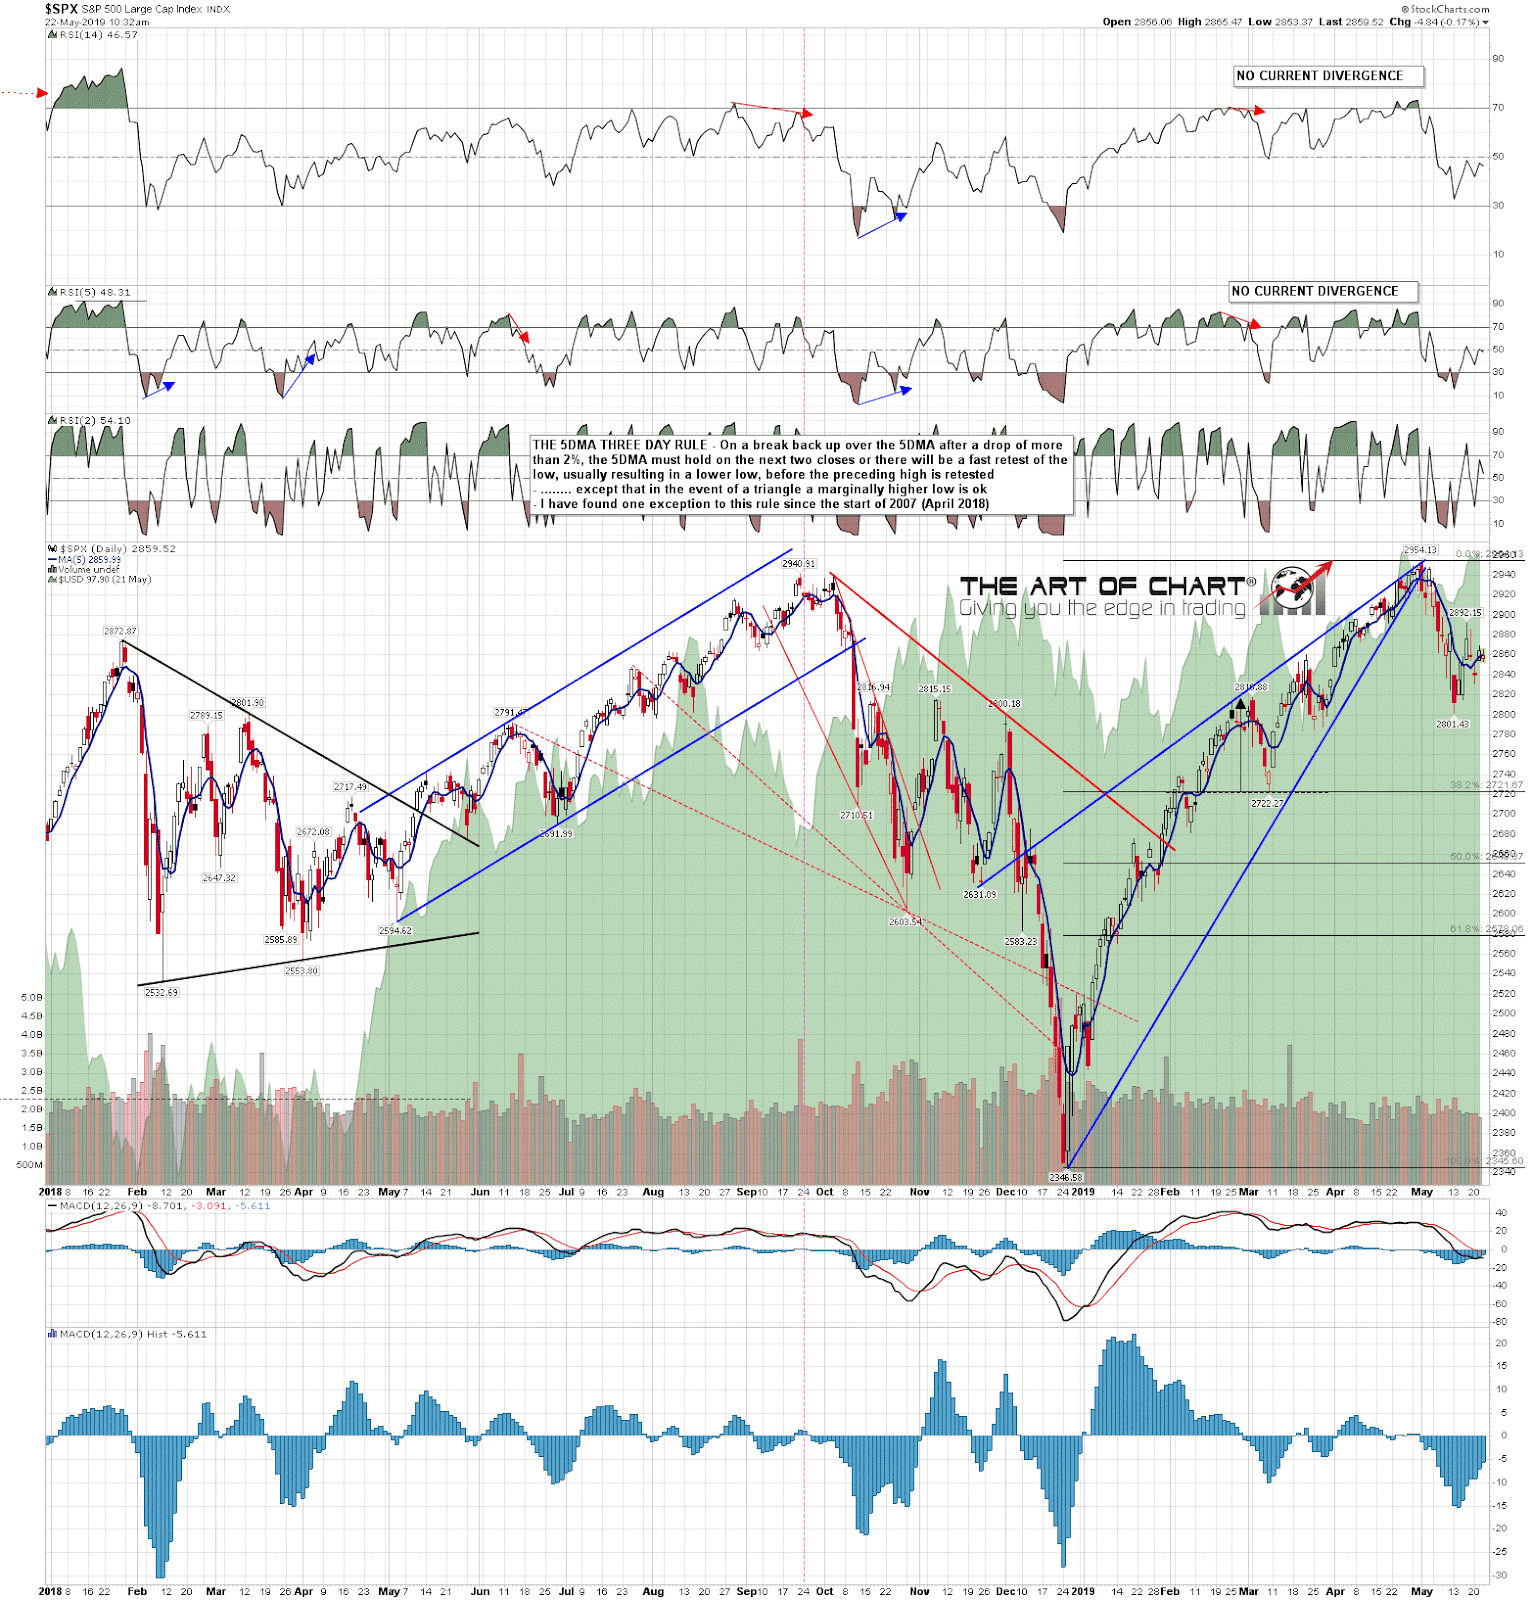
In terms of the timing of that retest there are a few things to consider. The first is that the next cycle window is close, with the middle of that window on Friday this week. That can run into the middle of next week but that is not a lot of time to make this low. Unless there is some really impressively bad news the next retracement low may not be much below 2800. We will see.
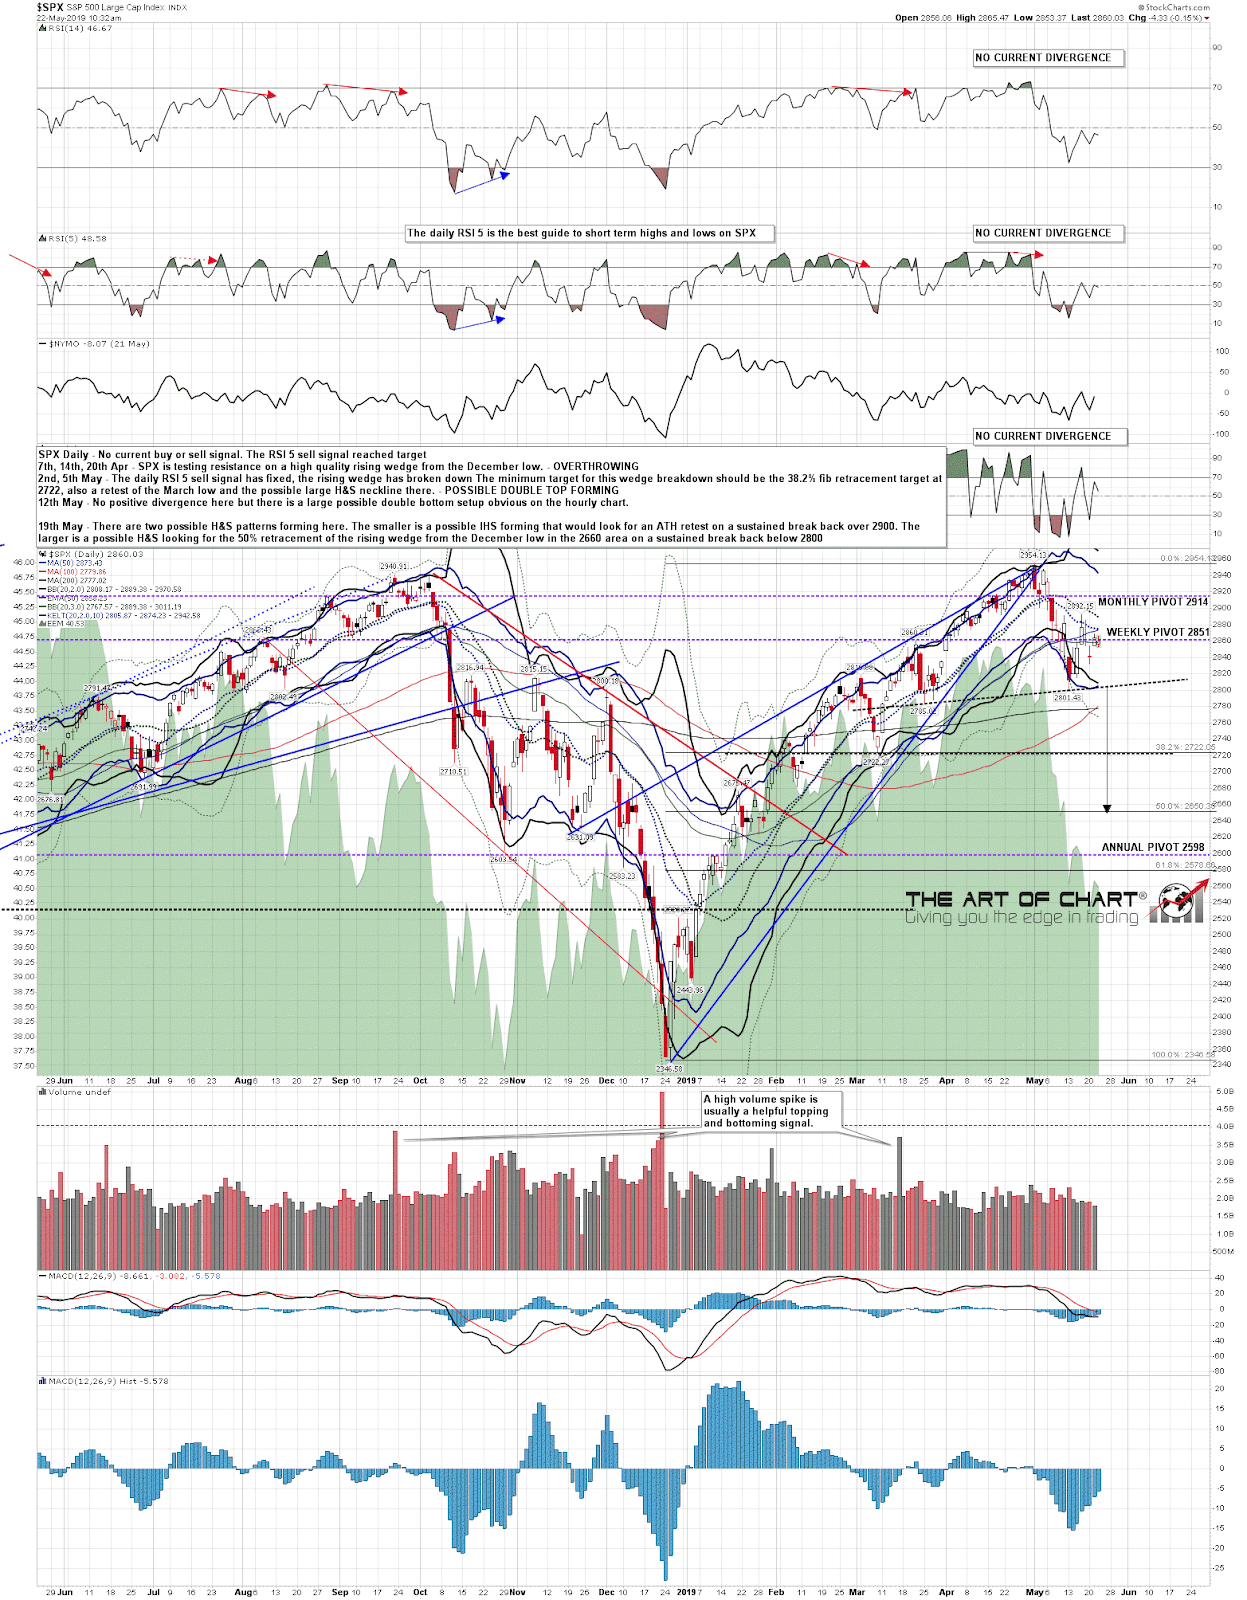
What are the support levels? Well I have possible H&S necklines in the 2785 and 2722 areas, with 2722 being my preferred option since we started this decline, though that’s a long distance below unless we start seeing some serious moves to the downside. I’d note that the daily 3sd lower band is now in the 2765-70 area, so a fair match with my first support level not far below 2800, and that on a sustained break below 2800 would now fix an H&S target in the 2650 area.
Given the short time available though, I’d note that the H&S setup here is very much a two edged sword. If that SPX neckline in the 2800 area breaks down, and then SPX rallies enough to invalidate the H&S with a move over the right shoulder high at 2892.15, then there would be a strong Janus Flag target at a retest of the all time high, and we will be looking for a possible strong rally back into June, so that would be a decent fit with cycles.
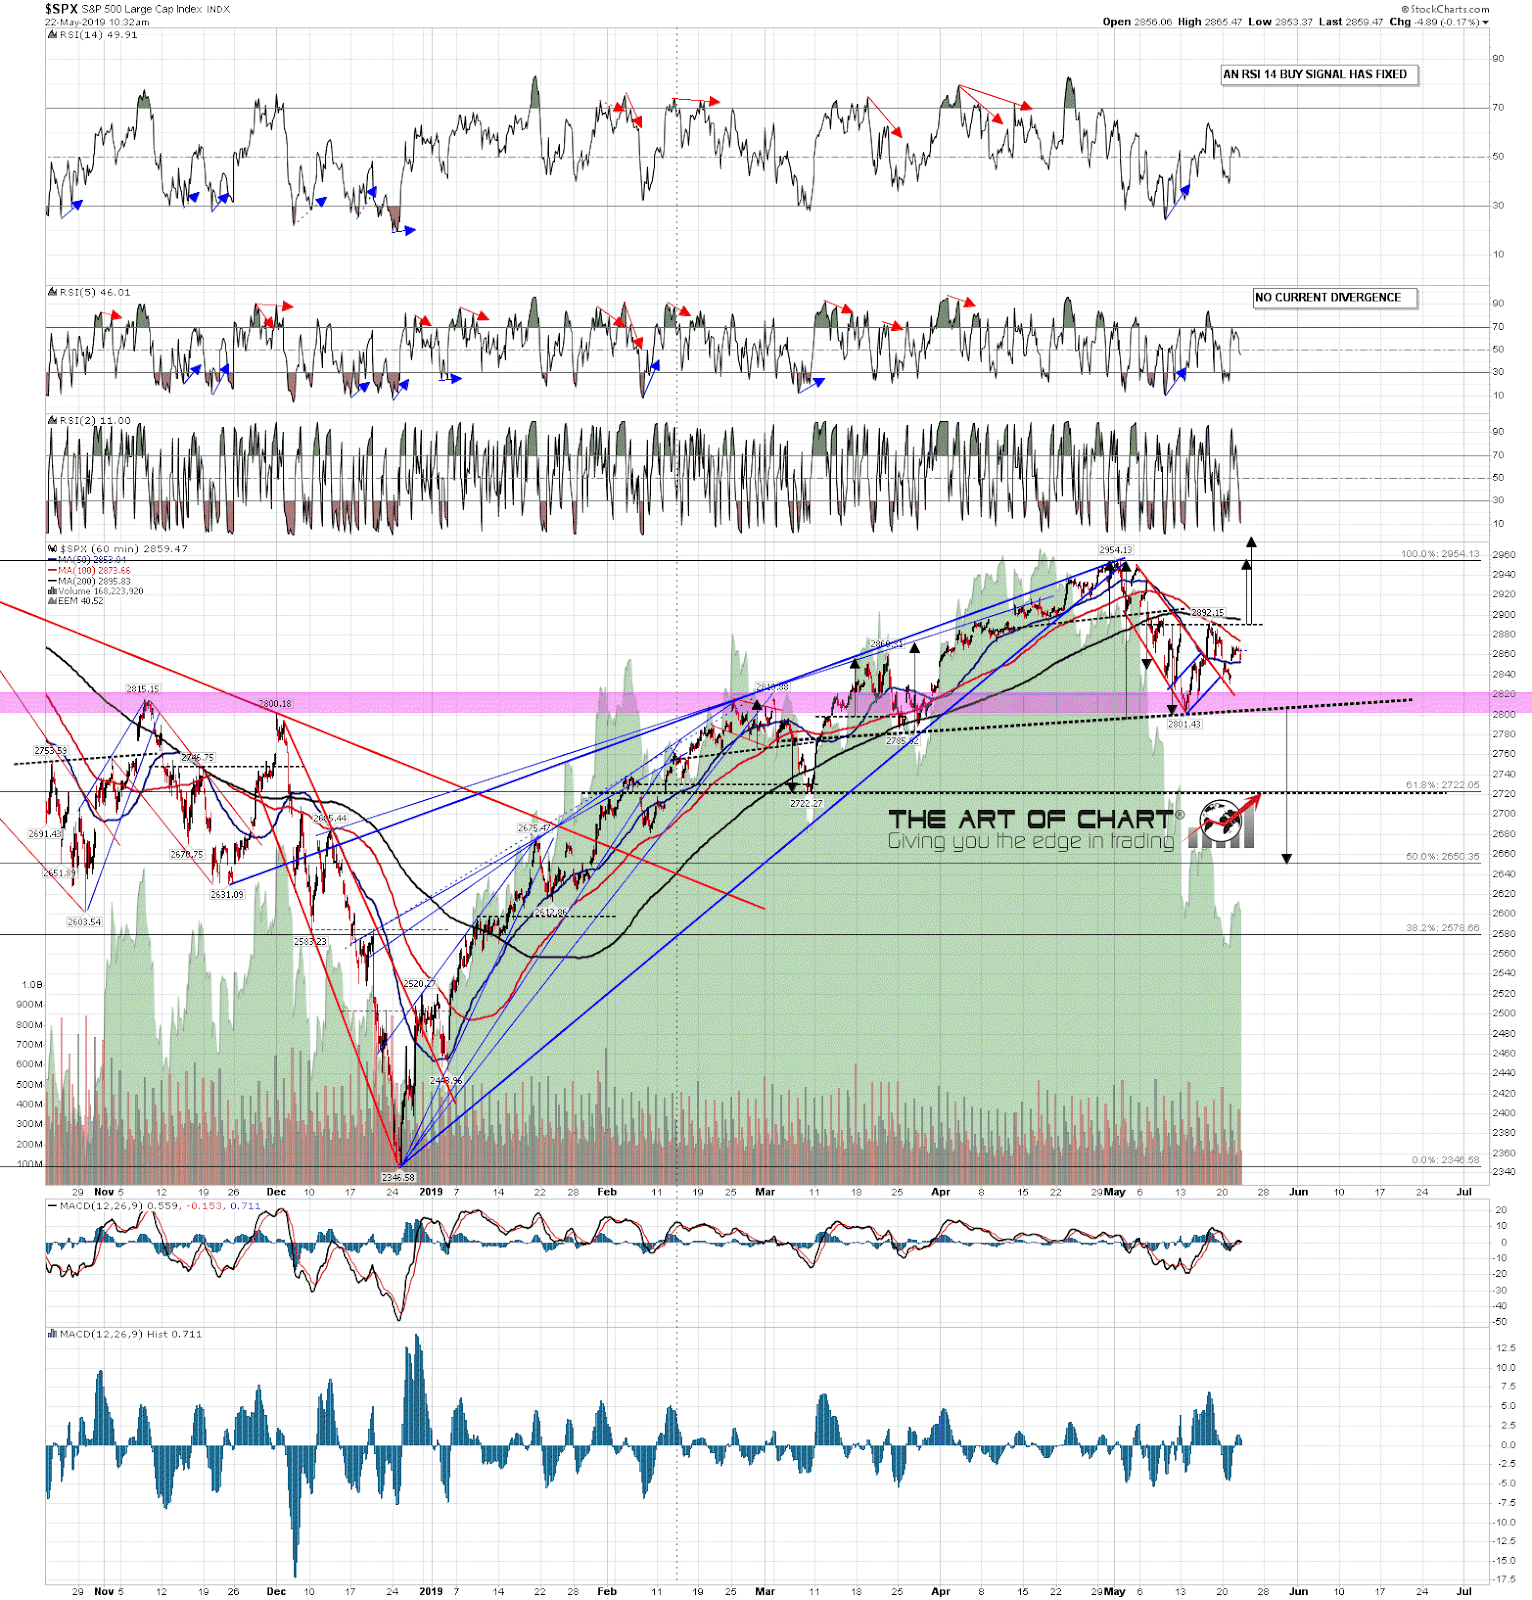
To start the move down into the 2800 retest the first support level is at the weekly pivot and 50 hour MA on SPX in the 2851/2 area. A break and conversion of that to resistance opens the low retest.
SPX 60min chart:
On the daily chart I’d note that on a retest of 2800 from here, then a possible daily RSI 5 buy signal would start brewing. On the retests of the retracements lows on NDX and RUT, similar daily buy signals would likely also start brewing. SPX daily chart:
The remaining cycle trend days this week are today, not looking too trendy so far apart from on CL, and Friday. There is a big news day tomorrow with the Fed, and random news bombs can come at any time of course on trade war updates. The trade war news has been pretty grim over the last few days, and that being the case I’m a bit surprised that SPX isn’t closer to a retest of 2801 already.
An hour after the close on Thursday 28th May Stan and I will be doing the third webinar in our Trading Commodities series. If you’d like to attend you can register for that directly here, or on our May Free Webinars page of course.
 22nd May 2019