It has been strange watching the markets climb higher in this tremendously strong impulse at the same time as the Fed and others have been talking about a possible contraction in world GDP this year of 25% or more, by far the worst world contraction on record, in the shortest time. I noticed an analyst tweeting about a conversation he had with a four year old last week about the markets where the four year old was talking about just buying in the expectation that an even greater fool would buy the position at an even more absurdly higher price in the near future. That seemed surreal, but the markets look increasingly surreal at the moment.
So the question is where the greatest fool might be found, the one that buys this bubble high, and the search for that fool soon might be over, if my NDX chart is to be trusted. Let’s have a look at that.
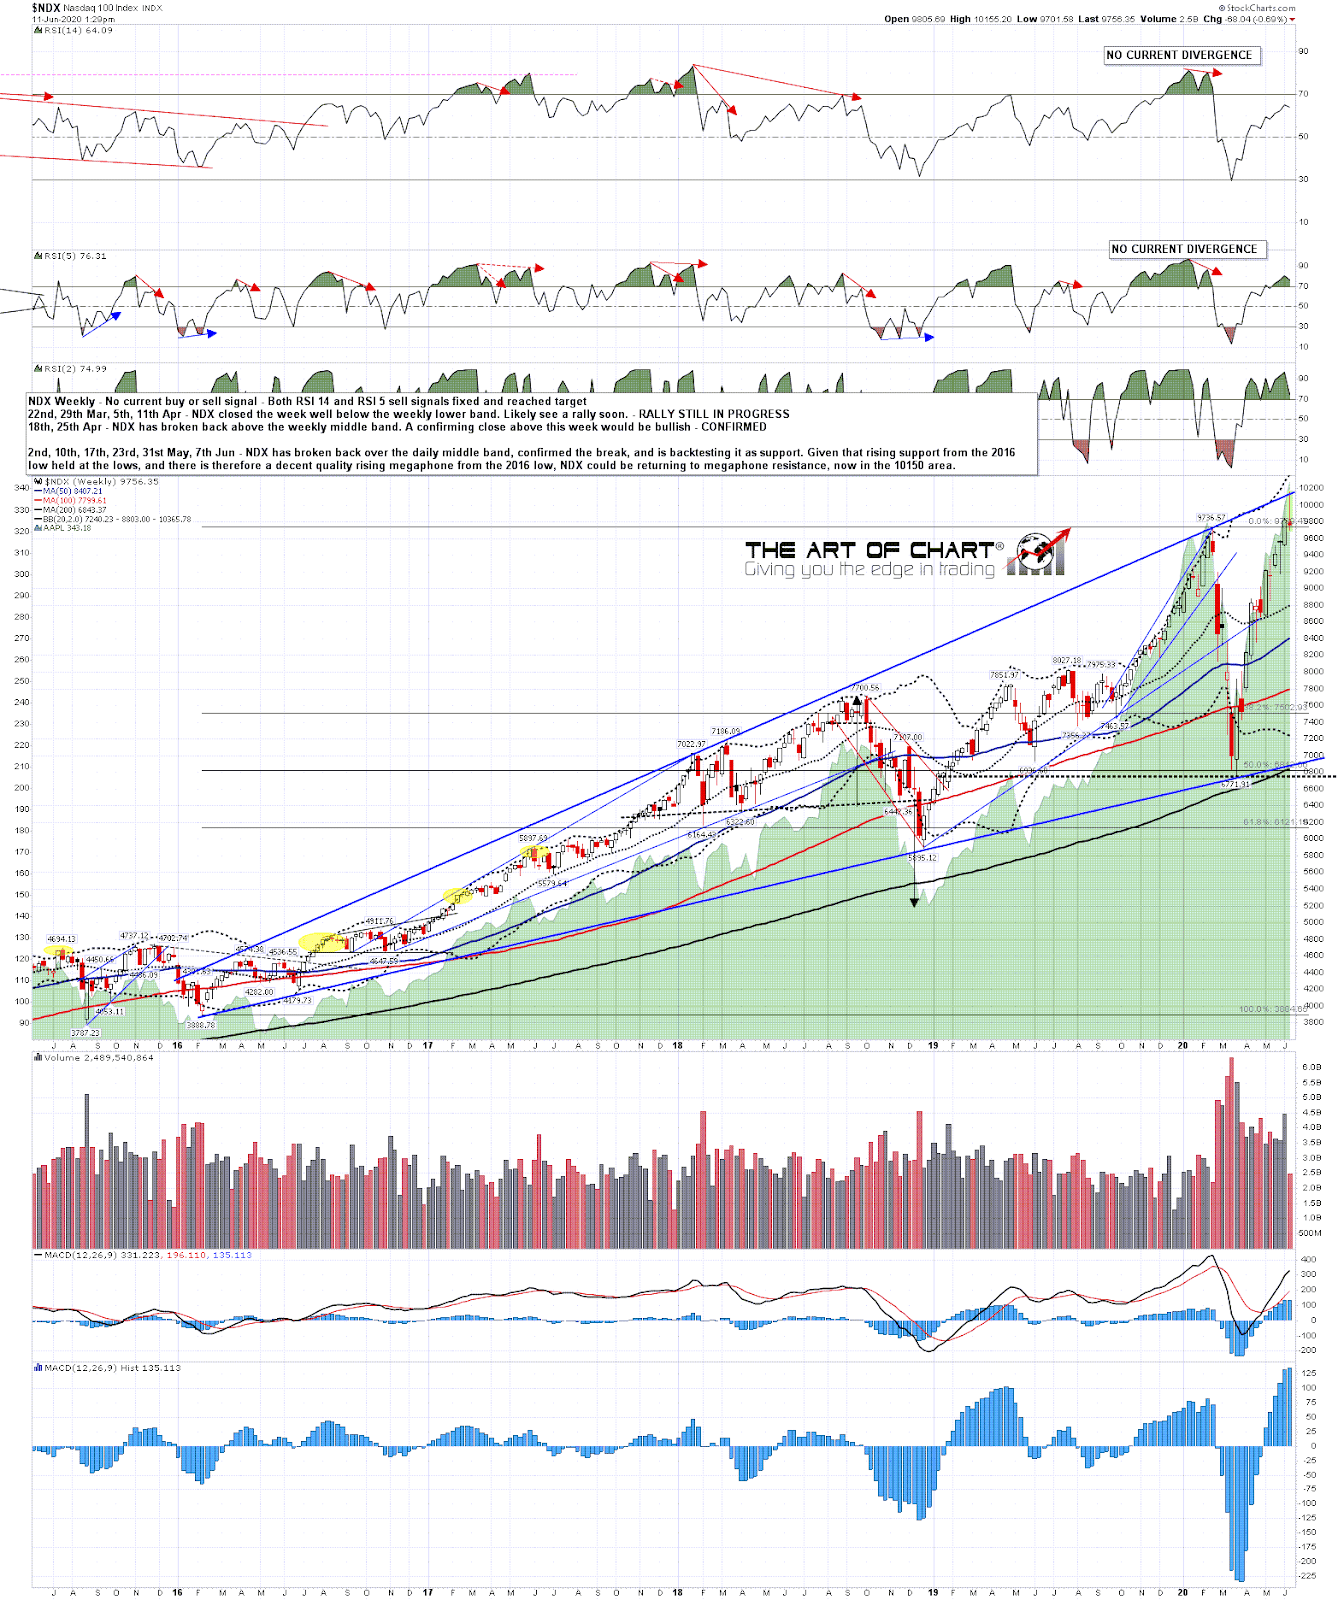
On 20th May I posted an NDX weekly chart looking for a new all all time high, and ideally a test of the rising megaphone resistance trendline from the early 2016 low. This is how that NDX weekly chart looks now, with that megaphone resistance tested yesterday and holding so far. If that resistance holds then this collapse up from the March lows is either finishing or finished.
NDX weekly chart:
So what now?
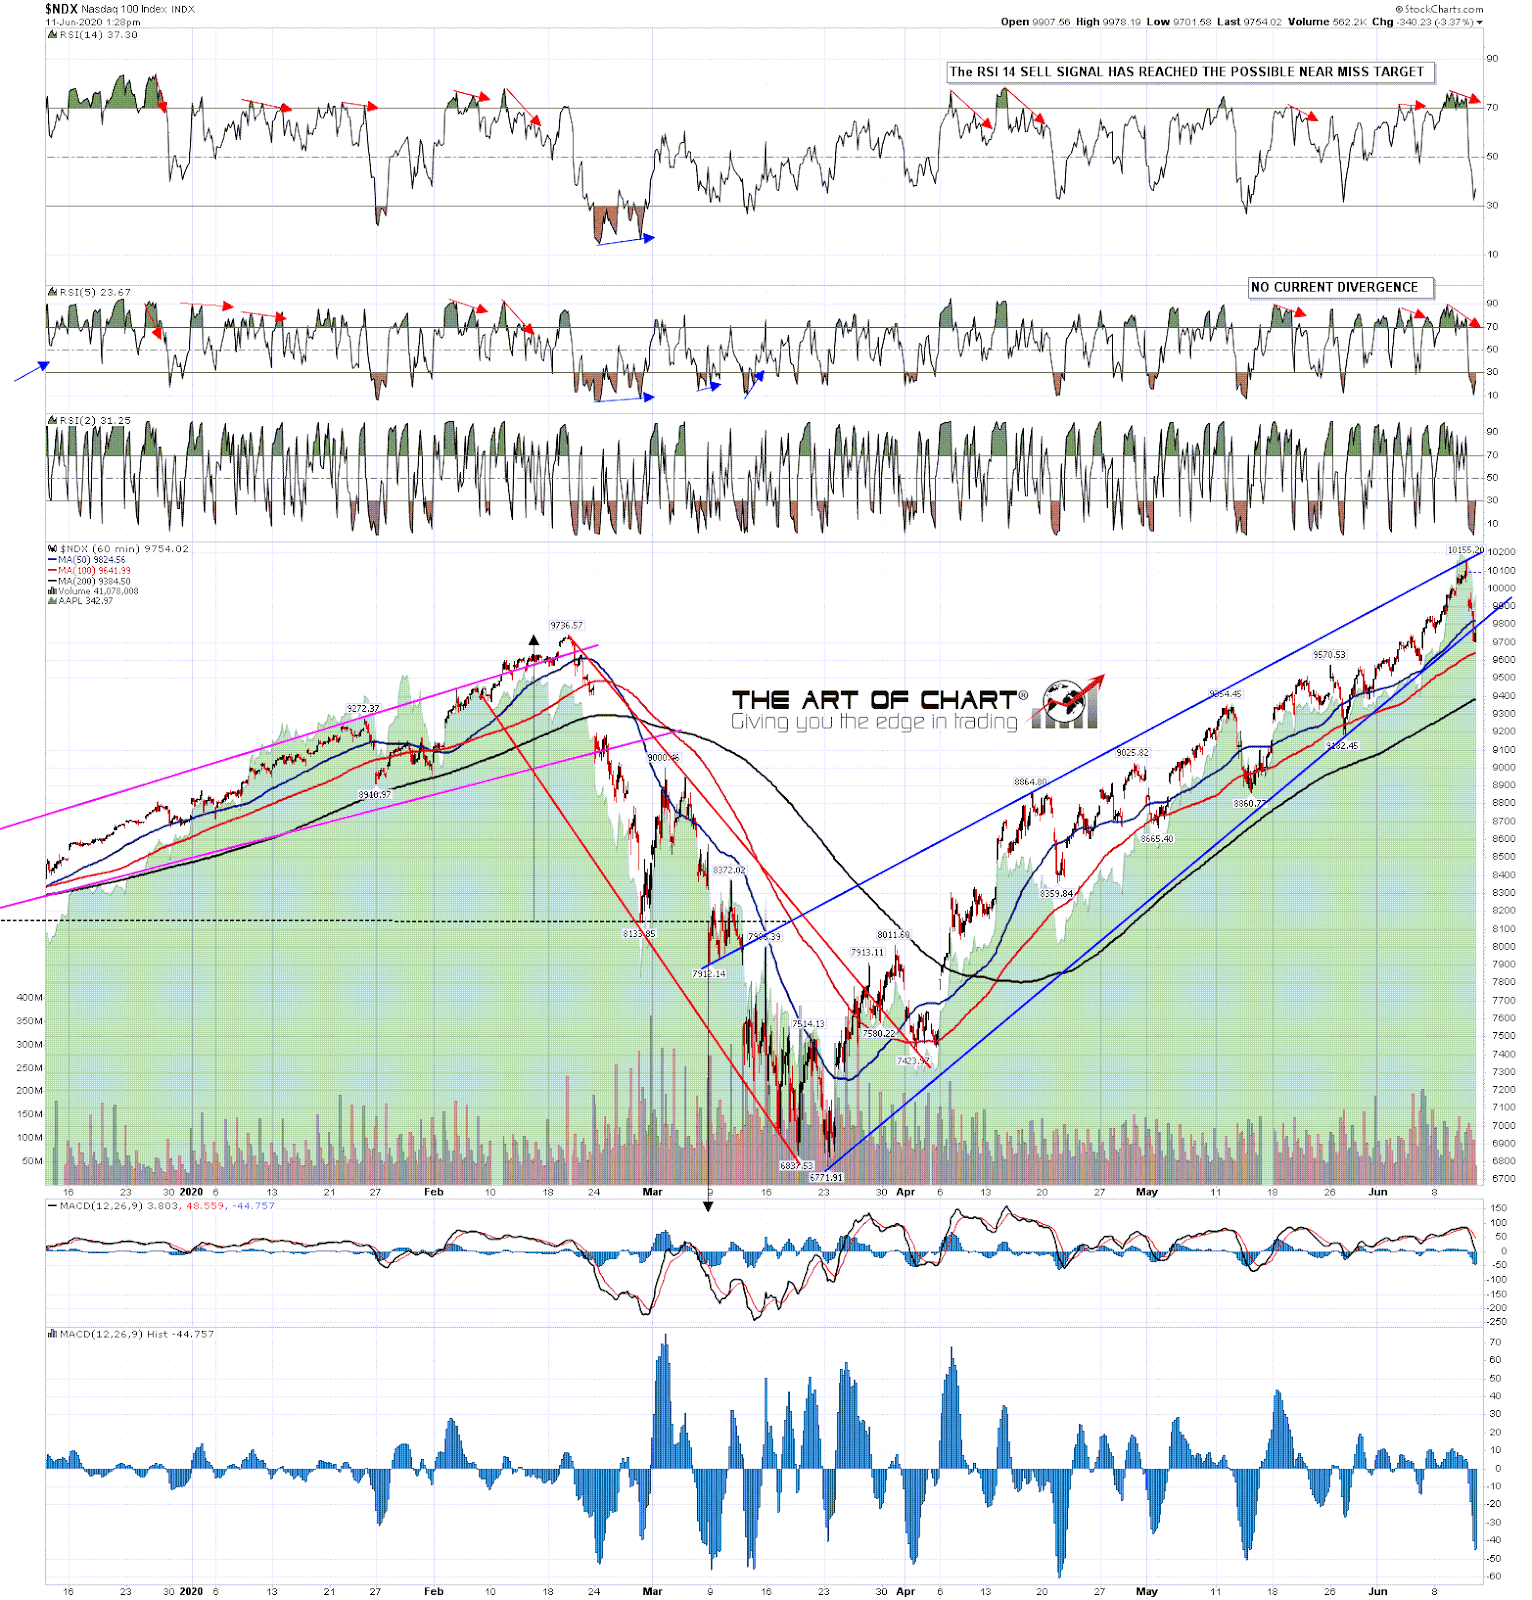
Well there has been a sharp retracement from the high yesterday and that has broken the main rising support trendlines from the March lows on both NDX and SPX. That puts both into potential topping processes here and I’m looking for possible topping patterns to form, ideally involving high retests to set up double tops.
NDX 60min chart:
I would note that on SPX the gap down this morning has left a possible island top. I’m expecting a rally soon, though with buy volume at the time of writing just a whisker over 3% that may not start until after the close tonight, and the possible resistance I’ll be watching above will be that island top gap, slightly above the 50 hour MA, currently at 3157 SPX. A break and conversion of the 50 hour MA on the next rally opens a retest of the highs seen this week.
SPX 60min chart:
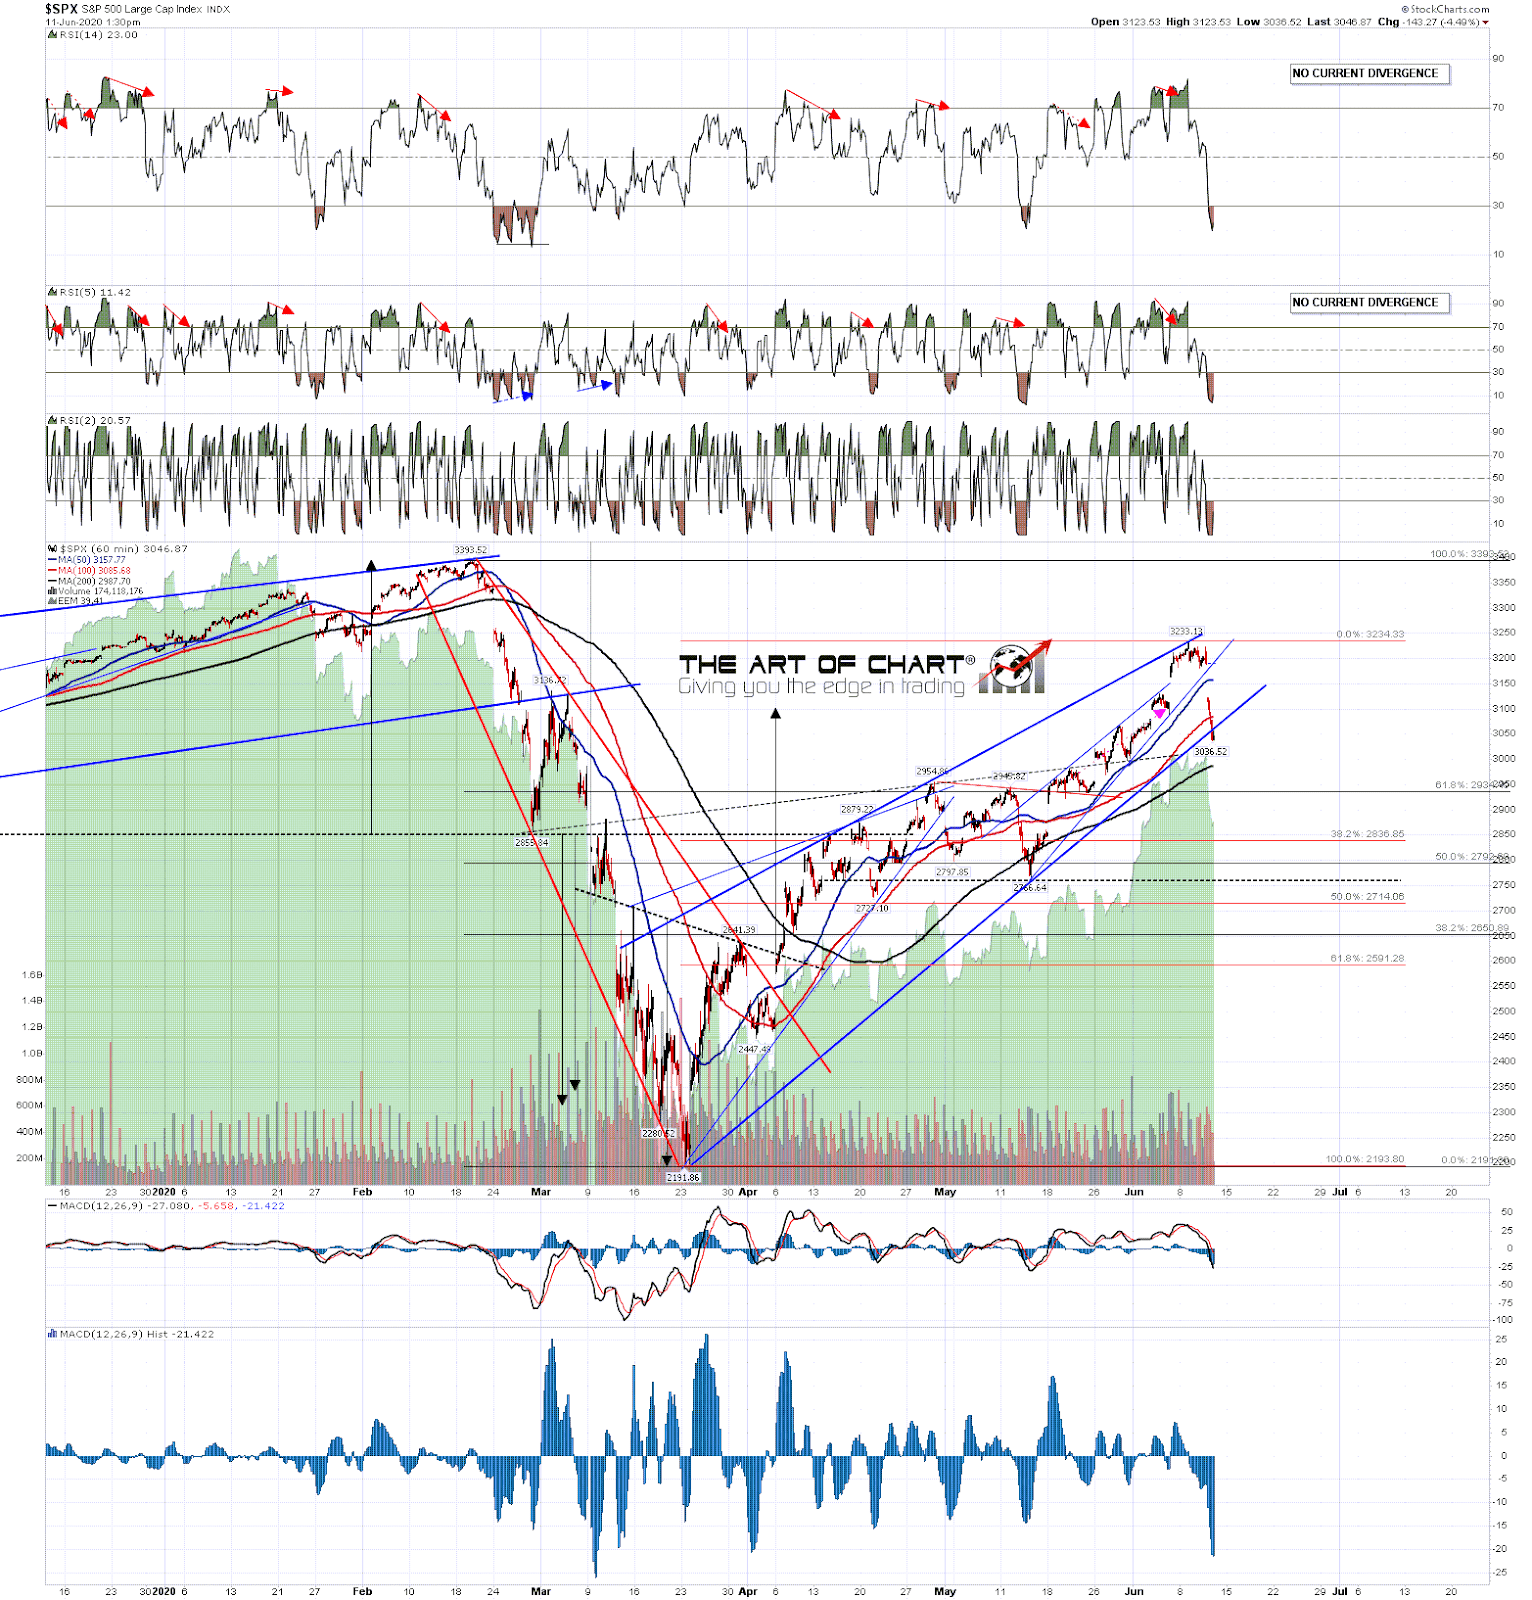
If that rally starts without SPX declining much further, and the low so far today is at a very decent support level at the daily middle band, then a high retest should set up a high quality potential daily RSI 14 sell signal and a possible double top setup that would look for the 38.2% fib retracement target of the move up from the March low in the 2850 SPX area. That would be a very decent topping setup, looking for a move to the next big inflection point area.
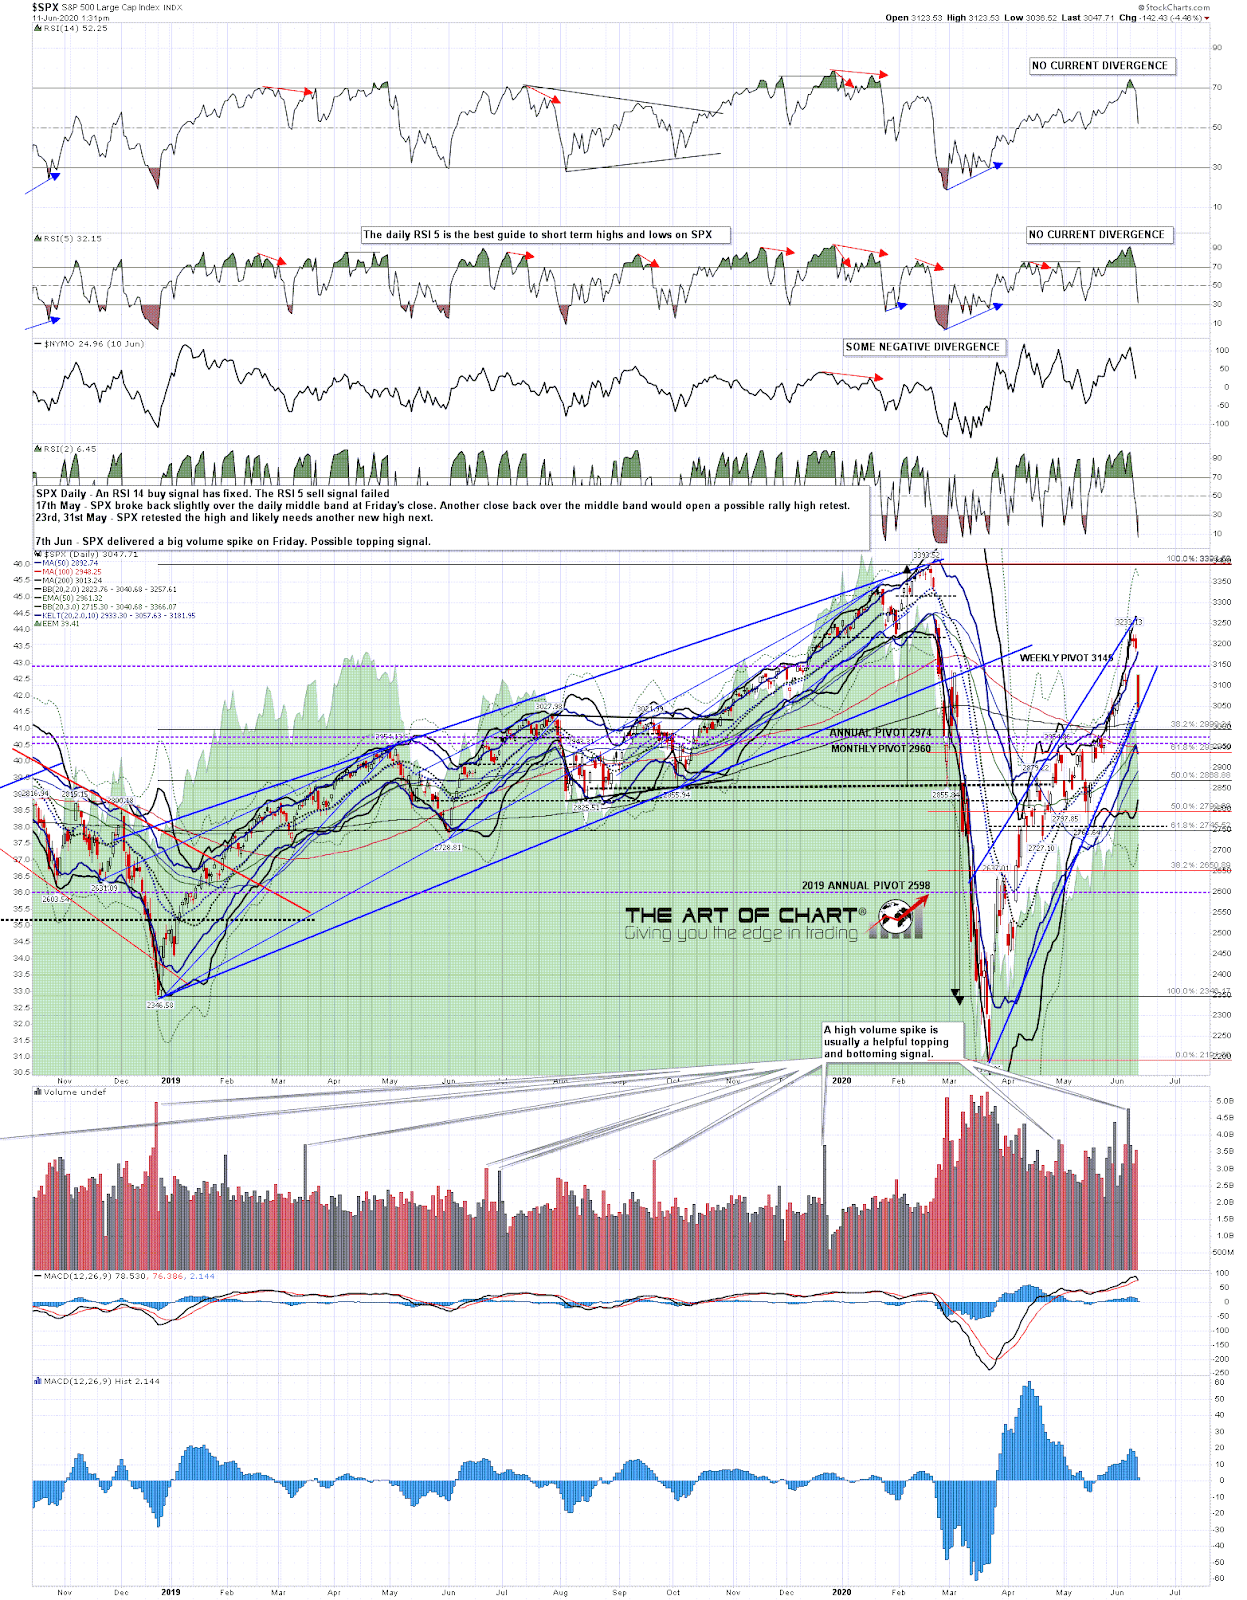
SPX daily chart:
What are the prospects for NDX reversing all the way back to the rising megaphone support trendline? Pretty good I think but we’ll see. In the event that happens then that might well take the rest of the year and more, in a bear market that might last a couple of years or so. The high in 2000 delivered a 30 month bear market, and the 2007 high delivered an 18 month bear market. These things generally take a while.
There has been a lot of talk about a new bull market here that will last for years but there’s no obvious reason to expect one. The economic news is dire, and getting worse, and it will likely take years to recover from this economic contraction. That’s not my assessment, that’s from the Fed.
Is the Fed going to wave a magic wand and make it all go away? Well they’ve been very clear that the answer is no. They are standing by to fix any liquidity issues but Powell has stated repeatedly that the Fed cannot intervene to stop an economic contraction. As the economic story this year is about an unprecedentedly fast and brutal economic contraction, that message seems clear enough, and at these levels that is not at all priced into the market. Over the rest of the year I’m expecting that to change.
Could I be wrong? Sure. The market doesn’t do what I tell it to, but history says this market is in for a difficult period ahead, and wishful thinking about ever higher highs stretching over the horizon is something that is usually plentiful at big tops. Certainly no shortage of that around at the moment.
 11th Jun 2020