The Options Trading and Investing service provides perspective on high quality setups and option trading strategies for the coming week. We carefully select these setups due to their quality and profit potential and we report back on results. This week we review current portfolio performance and an adjustment closing part of the GDX position. We discuss the planned initiation of an adjustment to the existing USO position and a potential new position in SLV. Finally, we preview a short position in AMZN which will be initiated at the proper time based on Stan and Jack’s chart analysis.
Please refer to our education video HERE for more information in the option strategies used in this post.
A summary of the plan for the week is summarized in the video below. The entries and cost basis will be highlighted on this post and on our private twitter feed.
Below is the technical review of the current option’s portfolio positions.
Performance of all positions. The ‘trade price’ that shows on the same line as the underlying instrument’s symbol is the closing price from the day the position was established and the ‘mark’ price is the previous day’s closing price. For instance, Apple closing price on the day the position was established was 139.79 and the last closing price was 143.34. The portfolio has a definite bearish lean in the stock and stock related ETF’s. Need to see a move lower to see profits. Even a 1% – 2% move lower in each underlying will see a dramatic shift in profit. We are projecting a much larger move than that over the next few months. Time is not an issue as they are all longer term positions.

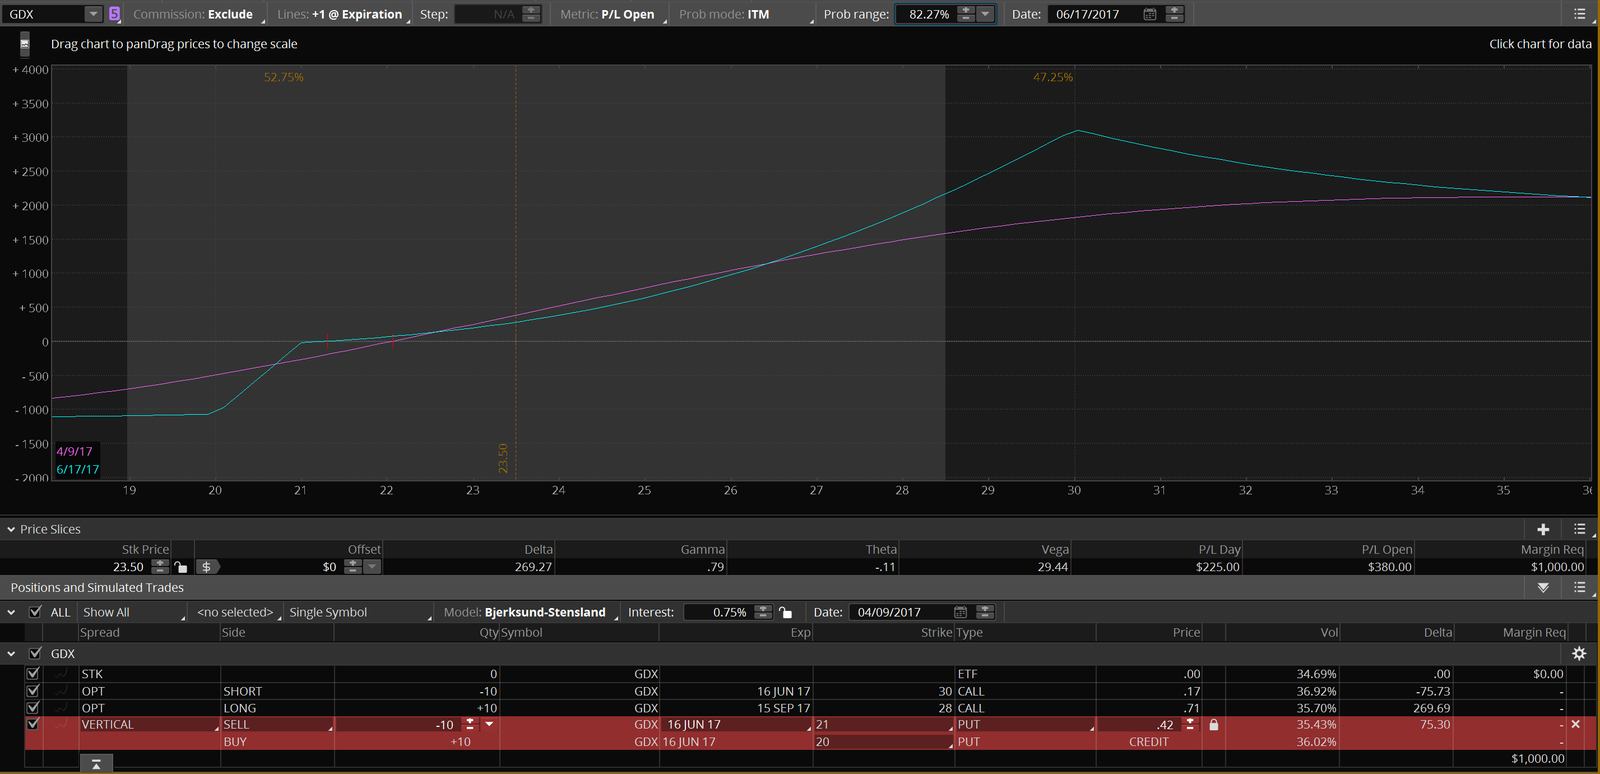
If you utilize defined-risk option positions and you have managed your risk at trade entry then you don’t have to pay attention to your risk after the trade is established, correct? Let’s look at the bullish GDX position to figure out the answer. There were 2 components to the position; a short Put Vertical (credit) Spread and a Diagonal Call Spread. The Put spread is defined risk which means that the maximum amount to lose in the position is defined at trade entry. The Diagonal spread was to provide a directional component to the position as well as increase the exposure to Vega where the vertical spread was to provide positive Theta. I originally sold the $1 wide Put spread for $.42. The most that can be lost on a $1 wide vertical credit spread is $1 less the credit I received. So my max loss that was defined at trade entry was $.58 or $580 for a 10 lot. Max profit was the $420 I collected in establishing the position. That risk profile begins to change the moment I establish the position. On Friday afternoon Stan mentioned we may be looking at a turn lower in GDX soon. The credit spread at that time was worth $.20. Since I sold it for $.42 I had realized more than 50% of the potential profit. What was my current reward/risk? When I established the position it was $420:$580 reward/risk. However, on Friday afternoon it was currently a $200:$800 reward/risk. How is that possible? The risk was defined at trade entry to be $580. How could it go up? You must always consider your current risk going forward in an options trade, not just what it was at trade entry! As of Friday, the portfolio’s net liquidity (Net Liq) was up $220 on the position. If I didn’t close it, I could give that $220 profit back plus lose the original risk of $580. So, I was risking giving back $800 in Net Liq with the possibility of only making an additional $200. Risking $800 to make $200 meant my reward to risk ratio was now 1:4. Another way to look at it is the max loss is the width of the spread ($1) less the credit remaining in the position ($.20). That means I am risking $.80 to make an additional $.20. With Stan mentioning a potential turn in the very near future, that ratio didn’t appeal to me so I closed the position. That doesn’t mean I have turned bearish on GDX, it is simply risk management. The bottom line is to always reevaluate your reward/risk as a trade progresses. Closing a profitable position early often makes sense. Think about how much the position can add to your Net Liq or how much it can subtract from it going forward. That is your current reward/risk and it is the only ratio that matters in risk management.
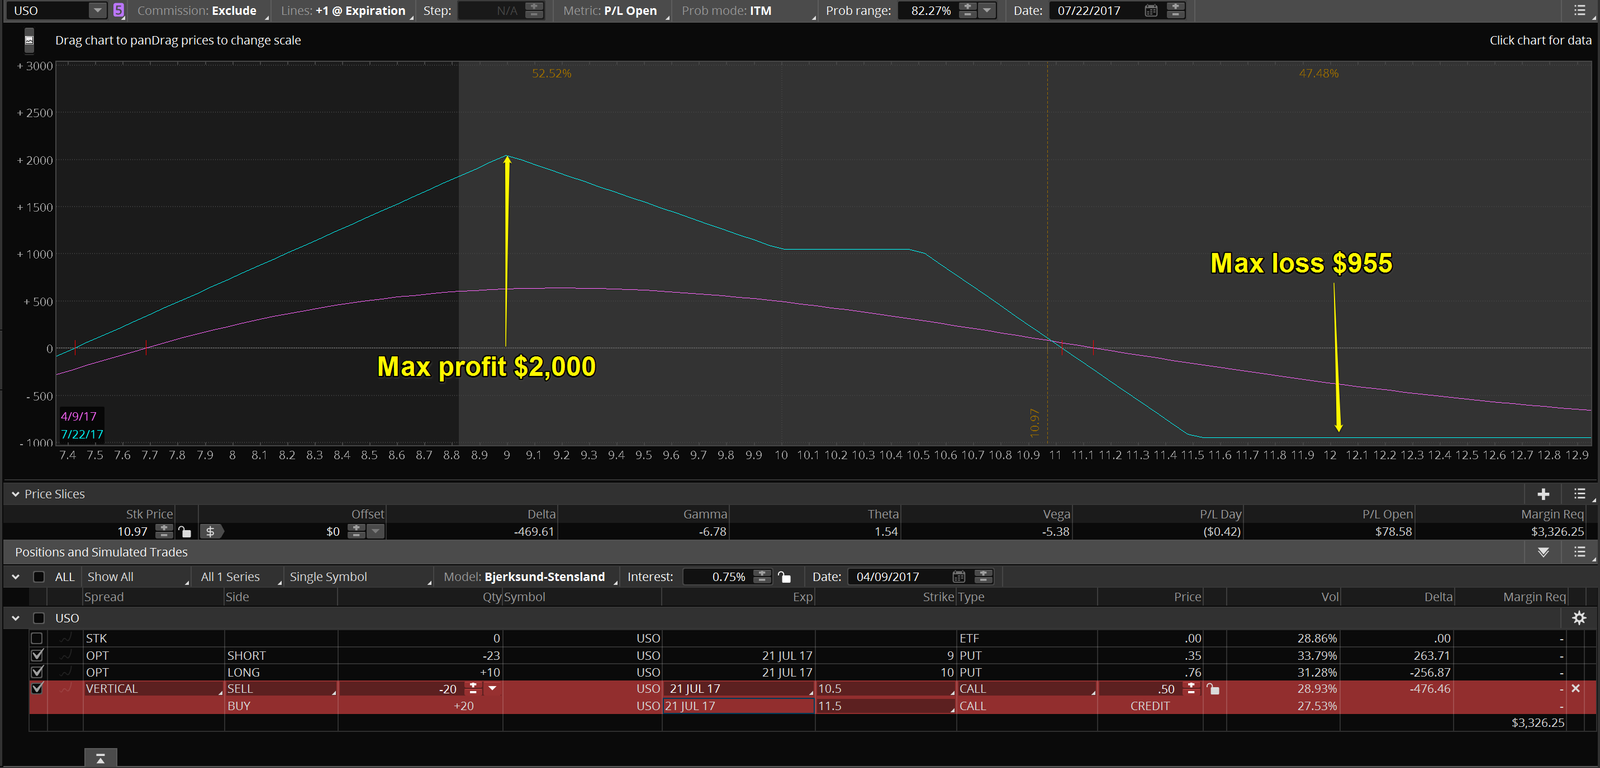
Current position in USO. This was established as a bearish position just prior to the latest rally in oil that Stan projected correctly. Why establish a bearish position if I expected the underlying to go higher in price? This position was established for a net credit which means there is no risk to the upside. The max risk and profit is to the downside. So I want a move lower but not too rapidly. By establishing the position before a rally it bought the position some time for the CPL to move higher.
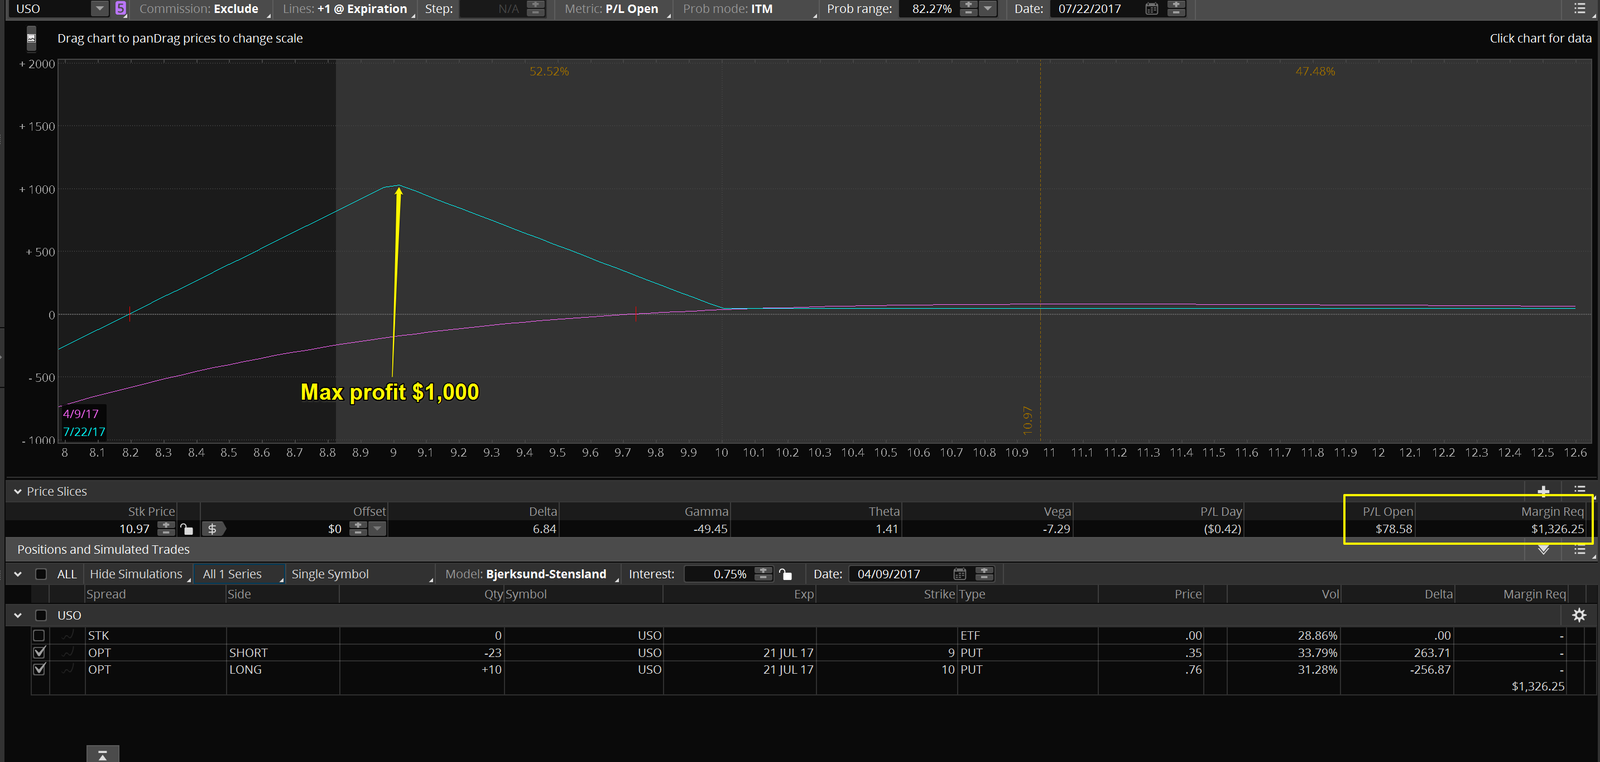
If I sell a 20 lot $1 wide call vertical credit spread for $.50 I will add $1,000 to the overall position max loss and profit. The current position was put on for a credit so there was no possibility of a loss to the upside. This adjusted position has a 2:1 reward/risk possibility and is Theta positive. I would actually sell the credit spread with May19 expiry instead of Jul21 because the credit is the same ($.50) but due to the shorter time frame the Theta is greater.
New position in SLV for this week. Expecting up to 10% higher by late April/early may. Selling ITM put spread and buying OTM call spread to allow for a higher reward/risk ratio. Only need slightly more than a 1% higher by expiry to break even. Max loss is 2.3% of $50,000 portfolio value.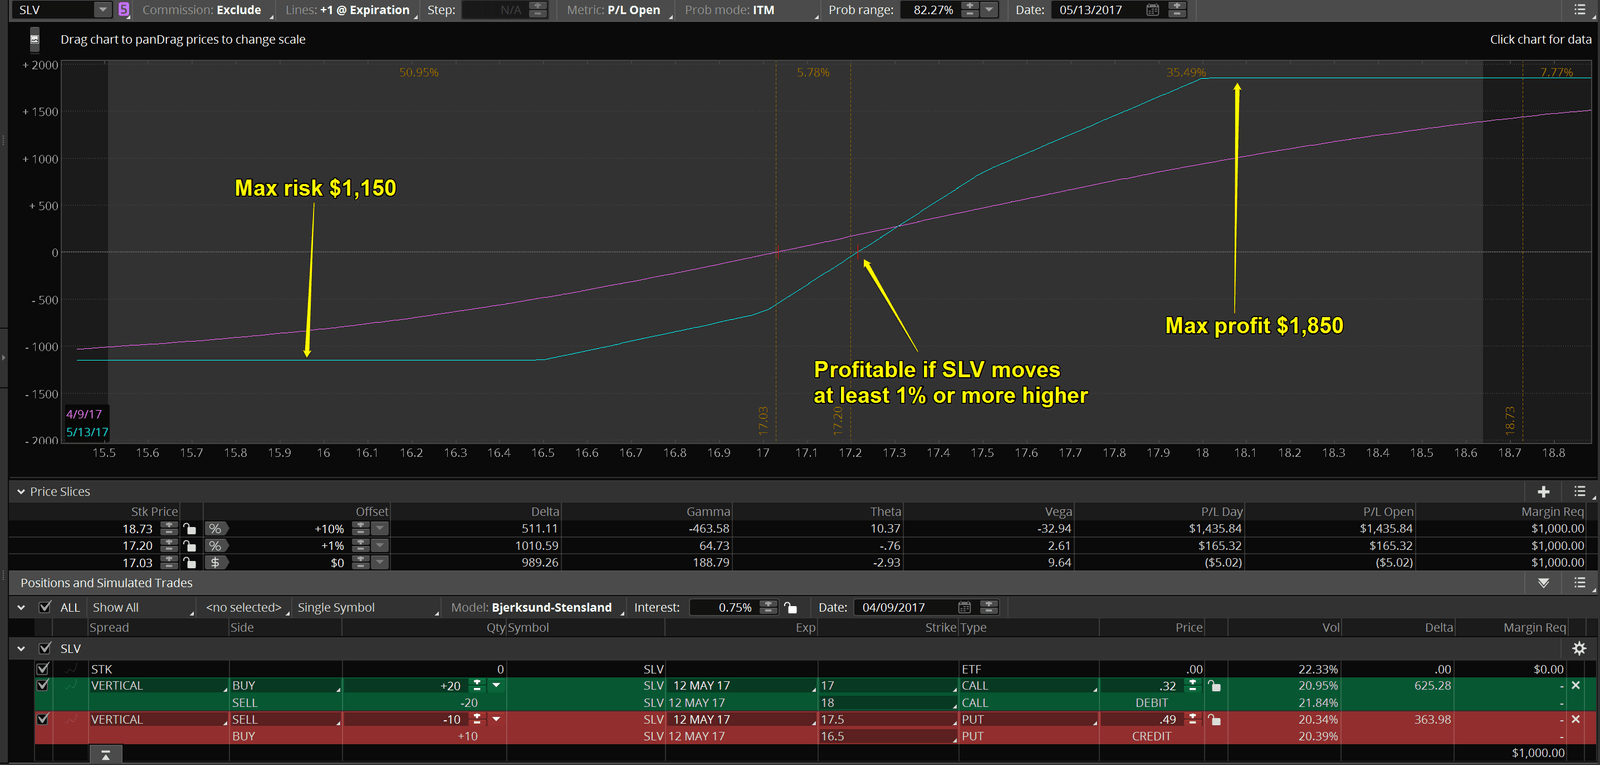
In the April 6th ‘ask us’ webinar, Stan got a question about buying an OTM option using a price target that he was projecting to be reached on a chart. Let’s look at a new potential position in AMZN to explain Stan’s answer to that question. Stan said he was fine with targeting his price target projections with OTM options as long as you utilized a structure that allowed you capture Theta. Theta is the option Greek representing the time decay of options. All options decay as time passes. Net buyers of options lose money due to Theta and all net sellers of options profit from Theta. Theta must be balanced against Delta which represents price movement. They are equally important to option traders. Let’s look at the trade to see how we would balance the 2 Greeks.
First, here is an example of a far OTM put purchase targeting AMZN being in the low $700’s by July. This position does not capture Theta. In fact it does just the opposite. The entire amount of extrinsic premium paid for this and any other OTM option ever purchased is lost due to Theta (time decay) as of expiration. For that option to be worth anything it must gain enough in Delta to overcome the loss in Theta. In other words, price must decline from it’s current level of $893.86 down to below the strike price of $770 just to have the option be worth anything at all. It must then decline another $8.40 just to breakeven on the purchase of the put. That is a heavy load to carry! So what kind of structure was Stan referring to in the ‘ask us’ webinar?
This position is a combination of a short Vertical (call) Credit Spread and a Broken Wing Butterfly (BWB). I left the price line where the OTM put breakeven was shown on the previous slide. At expiry, if the price of AMZN is $761.56, the long put would have a $0 profit where this position would have a $4,259 profit. It would also be profitable in a range of over $100 higher than that price. So why does anyone just buy a put? For the same amount of risk (both positions have about $1600 of risk), this position beats the long put all the way down to AMZN price of $720. Below that price, the long put will have a greater profit. There is no limit to how much money you can make on the long put. So buyers of options who don’t sell something against their long options will only be more successful if there is a much bigger move than projected. They are fighting both probability and negative Theta in their positions. 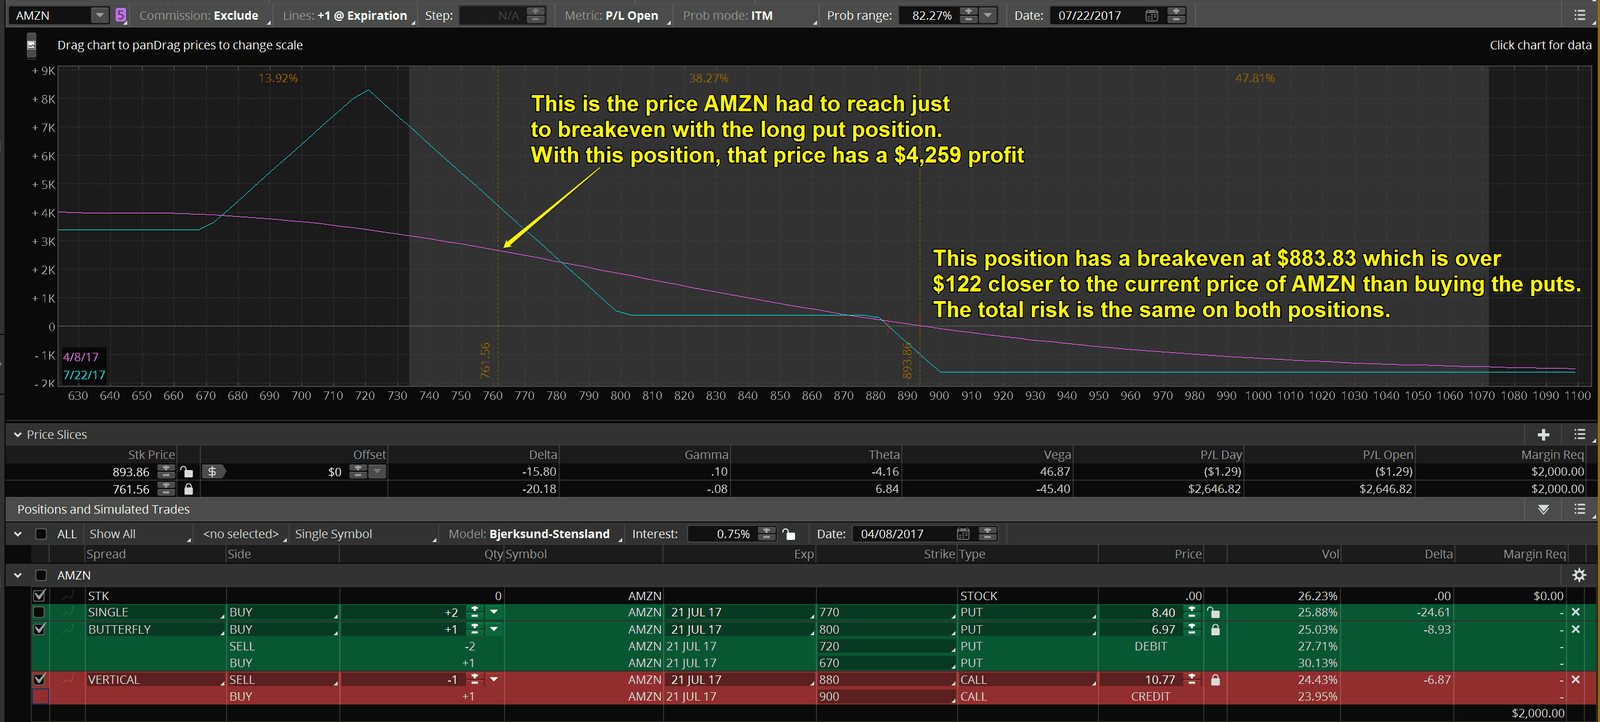
So this is what Stan was referring to in the ‘ask us’ webinar. We will establish a position where there is a peak profit in his projected price area (which is ironically achieved by selling, not buying that strike options) but that has positive Theta all of the way down in AMZN price from $883 and lower. We have mentioned that we are not probability traders which simply means that we select our target prices based on Stan and Jack’s chart analysis. However, that doesn’t mean we don’t try to utilize probability to increase our chance of making a profit along the way to their target price. Just in case you were wondering, the probability of making a profit by buying the Jul21 770 puts is just under 14% while the position we will utilize instead has a probability of profit of just under 50%. The probability, based on option pricing, of the long put being more profitable at expiry than the position shown below is about 7%. I’ll leave it to the individual to decide which position makes more sense for them.
This position will not be established until Stan sees a reversal pattern on a shorter term chart so prices will vary from this risk profile. Stay tuned to the Twitter feed for more details.
Save
 09th Apr 2017