The Options Trading and Investing service provides perspective on high quality setups and option trading strategies for the coming week. We carefully select these setups due to their quality and profit potential and we report back on results. Today we review current portfolio performance and a new position established in USO. I also discuss techniques that I may use to help the least successful portfolio positions turn into profitable positions.
Please refer to our education video HERE for more information in the option strategies used in this post.
The entries and cost basis of new positions will appear on our private twitter feed during the coming week.
The option portfolio has a total profit of $252 since mid-February inception. Not going to sugarcoat it; that isn’t great. What is the reason for the average performance? We all know how extended this market has become. Markets do that sometimes but usually not to the extant that the current market has. A couple of positions have been hit particularly hard because I established short positions 2 months ago and they still haven’t turned. This is why I favor longer duration option positions!!!!!! If I had established these position using the most typical duration of 30-60 days, I would have lost the entire amount of the defined risk on the positions. Instead, I am still in the game and if the market turns lower in the very near future these positions can still be profitable.
It isn’t all bad, we also have some bright spots in the portfolio. I will take a look at USO, UUP and GDX to highlight the power of diversifying the option portfolio. I will discuss how I can address the current challenge and what I can do to increase the profits to the downside on the AAPL and EEM positions without a significant increase in the risk to the upside.
The most profitable open position remains the short USO (oil) position. I added to the downside skew of the position on last Friday while maintaining the upside hedge that expires on this Friday. Also profitable is the RUT position with a $480 profit on just $260 of total risk.
Last week I added a new position by buying a 10 lot of the Jul21 USO 10.5/9.5 Put Vertical Debit Spread. That is an overlay on the existing position.
All new trades will be posted on the subscriber private Twitter feed.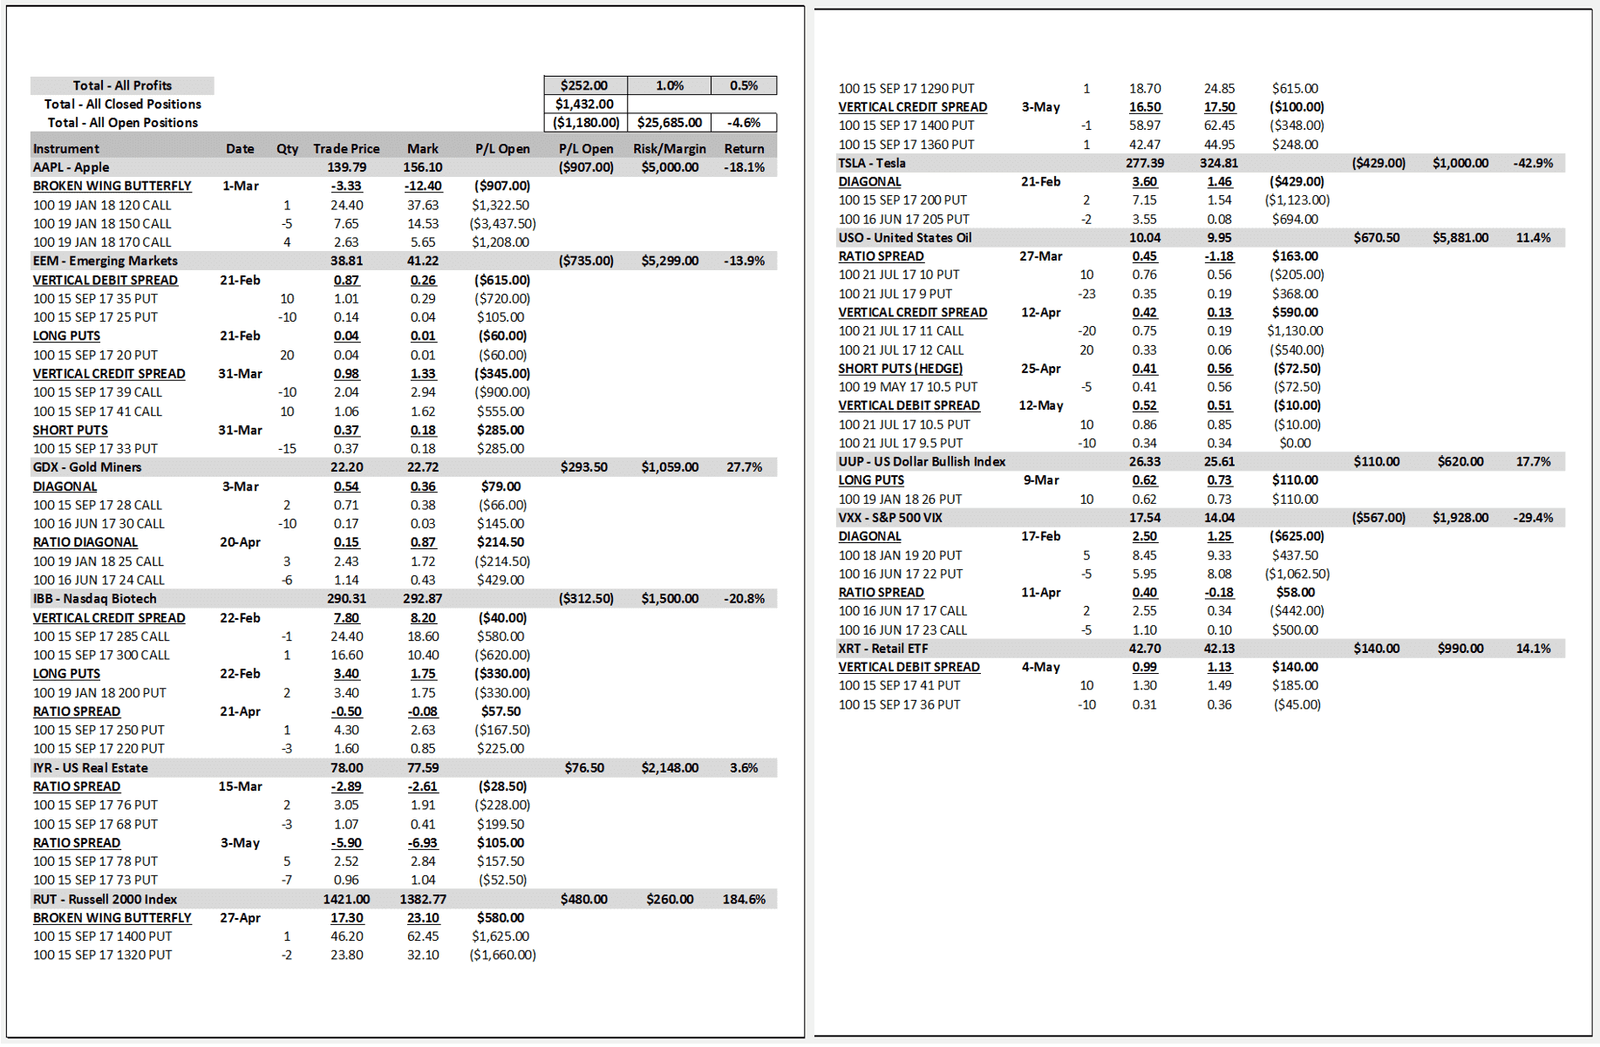
Below is the current position in USO (oil). The purple line is the current profit/loss, the blue line is the May20 profit/loss and the yellow line is the Jul21 profit/loss. The current profit represents an over 10% return on margin in less than 2 months. Notice the asymmetric nature of the position. A 5% move higher in USO price would lose about $70 from the current profit while a 5% move lower in price would generate an additional $931 in profits. So, risk $70 to make $931 on a 5% move. Notice also that a move to a USO price of either $9 or $11 generates additional gains from the current profit so you win in either direction. I always strive to have positions established that profit in an asymmetrical way to losses. You can also see that the position has positive Theta. If the price of USO just bounced around in a narrow range the position should still add over $200 in additional profits. This week’s addition to the position was tweeted out on Friday afternoon. Subscribers to the ArtofChart.net can go to #optionsAOC on Twitter to see all of the options related tweets from the past.
Speaking of the Twitter feed, if you search for #optionsAOC and then click on ‘latest’ you will see all of my (time stamped) option related tweets to the ArtofChart.net subscribers. You do need to be a subscriber to see the protected tweets in the feed. As you scroll down you will see all of my orders, fills and potential future positions listed in chronological order. Going forward, I will use the free weekend option webinars to review some of the past trades that I have established in order to maximize the learning experience that this option blog/webinar is attempting to provide. The most recent tweet was the order fill on the USO position I just covered. The tweet previous to that discusses an open resting order I had in the system on Friday. Lets look at that a little closer. 
I am a big proponent of cost reduction in the ArtofChart option portfolio. Why not? Reducing cost reduces risk and that is an important objective of a portfolio manager. Notice the small yellow box on the risk profile below. That shows the cost basis of the Jan2018 UUP (US Dollar) 26 strike puts that I own is $.62 ($620 for a 10-lot). I am looking to sell a 10-lot of the Sep15 UUP 26 puts for $.62 That is the price I have ‘locked’ in on the simulated position on the risk profile below. The line below that shows the ‘unlocked’ price of $.56 which means I need UUP a little lower in price to get filled at my desired price. If I do get filled at $.62 then will have a 10-lot Calendar Spread established with no cost (no risk). If UUP is at $26 (or higher) on Sep15 expiry then the Sep 26 puts expire worthless and I will just own the Jan2018 puts with 4 months remaining for no cost. What if Stan thinks UUP is going lower? Well, at anytime I could close this position at no worse than break even or I could just keep it for free and add a new short position in UUP since I don’t have to account for the risk in this position.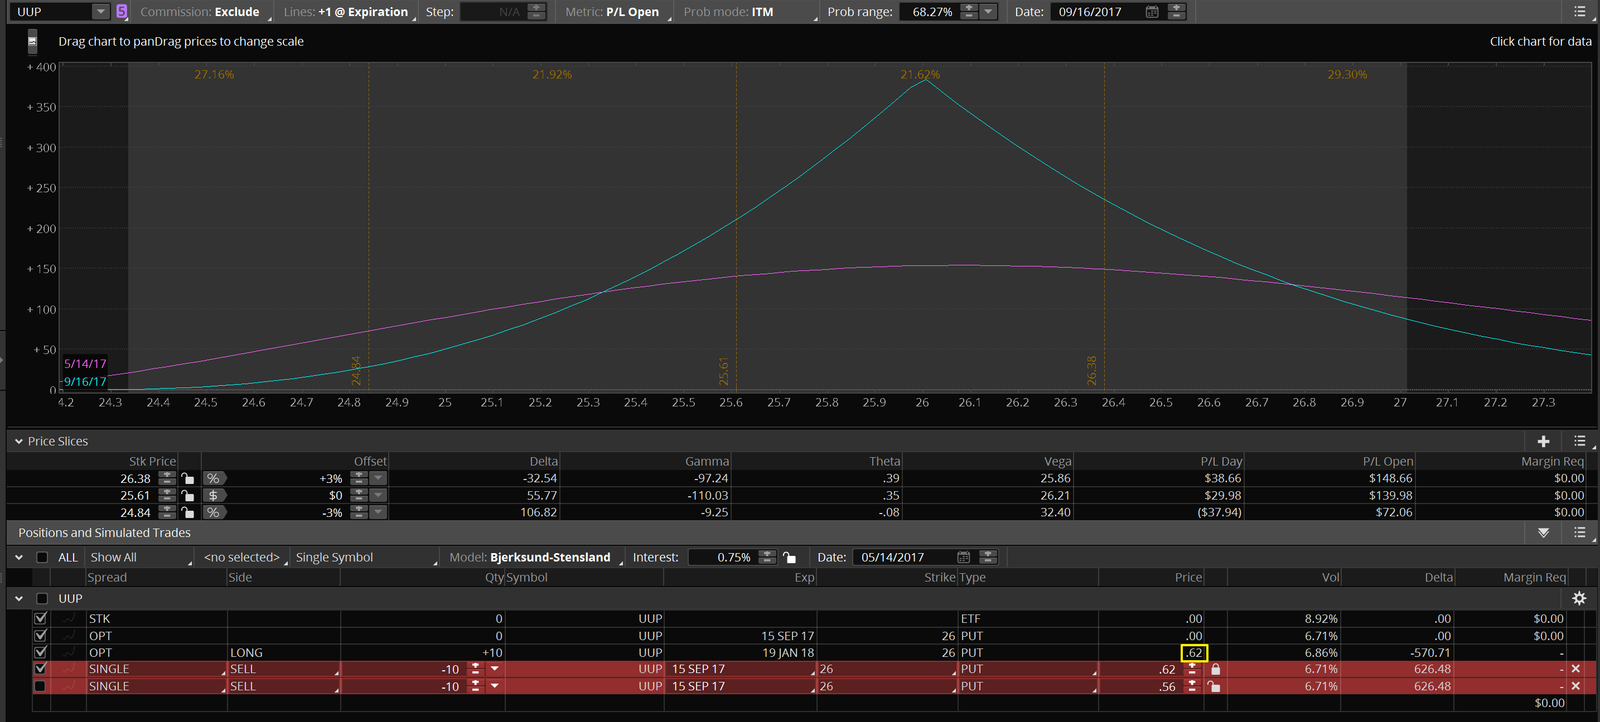
Below is the GDX position. Again, positive Theta is important as even if GDX trades sideways I will make an additional $200 in profits by Jun16. I show the plus/minus 5% price slices on the risk profile for reference. A 5% move lower by Jun16 expiry makes an additional $50 while a 5% move higher makes an additional $400. So, risk is an increase in profits of $50 on a 5% move lower and reward is an increase in profits of $400 on a 5% move higher. That is not a bad reward/risk reward ratio. Depending on Stan’s future chart analysis I will most likely overlay a directional position over the top of this current position.
This is one component of the USO position that we looked at earlier. On March 27th, Stan was projecting oil to go higher in the short term then move lower into July. I used that opportunity to establish a short term bullish, long term bearish position in USO using a Jul21 USO (10×23) 10/9 Put Ratio Spread for a $45 credit. Because I collected a credit on a put ratio spread I had no risk of loss to the upside. The worst I can do if USO is above 10 at expiry is keep the $45. If USO is at $9/share at expiry I can make a profit of $1,045. My downside break even point is $8.20 which is 17% lower than the current price. I don’t focus on option probabilities in this service since I use Stan and Jack’s chart analysis to guide my positions. It is still interesting to note however that this position has an 88% probability of making a profit by Jul expiry. The point is that these positions have a large range of profitability. The main reason I highlighted this component of the USO position is because of the implications that Put Ratio Spreads have in helping me increase profitability on a downside move in a position without adding to the upside risk. Imagine if I added something similar to this to the existing (losing) positions in AAPL, EEM, IBB and perhaps TSLA. Overlaying a Ratio Spread onto those positions could help recover more of the losses on the eventual move lower.
Here is the current AAPL position. Down $906. This is a defined risk version of a Ratio Spread type of position. Why am I down so much? I got ‘short’ AAPL on March 1st at $139.79. Obviously I was just a little bit early on that! But that is the past and you can’t trade in the past. So what do I do now? As you can see I can still make a $900 profit at the current price of AAPL if the price is at the same level in Jan2018. Ultimately, AAPL at $150/share at Jan2018 expiry is a $3,300 profit and there is no risk to the downside. However, based on the previous discussion of Put Ratio Spreads in USO, can I potentially improve this position?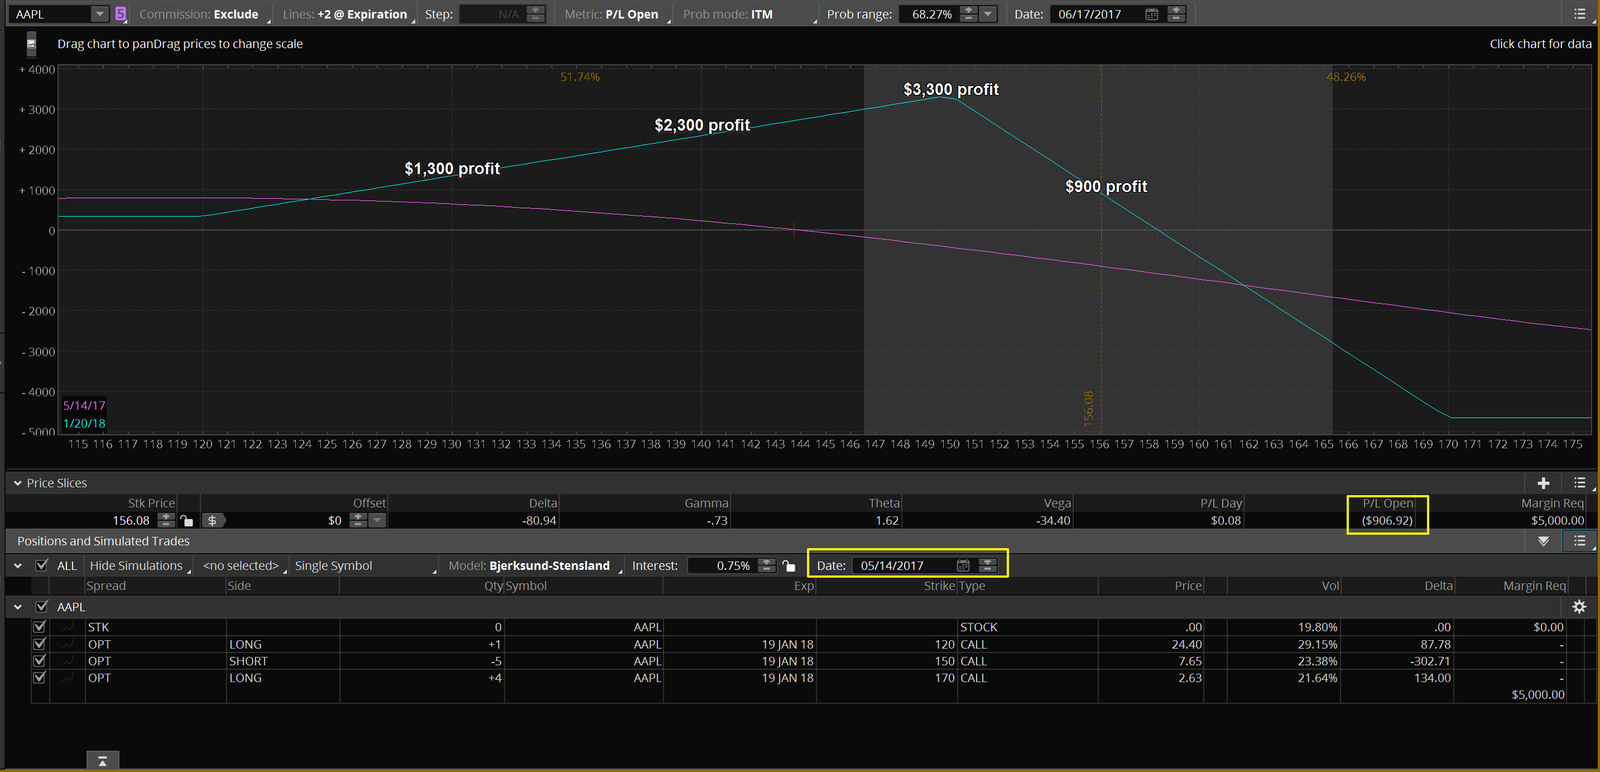
Here is the current AAPL position projected forward to Jun16. See how the $906 loss will decline to (approx.) $847 just from the passage of time. Now, lets just say that I think AAPL could drop to as low as $145 by Jun16. I am not picking that price based on Stan or Jack’s charts, this is just a theoretical discussion to help you understand how and why I consider these adjustments. 
Here is the current AAPL position projected forward to Jun16 after simulating adding 2 separate Put Ratio Spreads. The total cost of the 2 spreads (based on the prices shown) is $99. That is how much I would be adding to my potential loss should AAPL continue higher. What could I gain? If AAPL is indeed at $145/share on Jun16 then I will have a total profit of $1,400 for the adjusted position. That is compared to my current $906 loss and my anticipated $0 gain on Jun16 if I simply maintain my current position. The worst outcome for the Ratio Spreads would involve the price of AAPL falling below $141.50 by Jun16. So, I will consult with Stan to see if we can come up with a good target price for AAPL in the shorter term and then I will consider this adjustment. BTW, notice the jump in margin req. after adding the Ratio Spreads. That can be adjusted, if needed, by purchasing some further OTM puts and turning the Ratio Spread into a Broken Wing Butterfly. Check this weeks Twitter feed to see if I make any adjustments to current positions including AAPL, EEM and IBB. 
 14th May 2017
Paul,
I am a little confused on what you have listed for the RUT trade on Sunday. I thought after the adjustment the other week it was now the Sept +1 1290 PUT, -2 1320 PUT, +1 1360 PUT.
Ed, sorry for the confusion. I want everybody to really understand how (and why) I make these adjustments. If you combine the 2 positions that I showed as being ‘open’ on Sunday, you end up with the 1360/1320/1290 BWB as you correctly identified in your comment. For educational purposes I wanted people to be able to see how we now have a position on with just $80 of risk. I started with the original 1400/1320/1290 BWB and then sold the 1400/1360 put spread for a credit.
Looking at the current RUT position there is no loss and also very little gain also when the RUT drops. Seems it would have been much for profitable if the original position was left on.
Ed, that is true but unfortunately that falls into the category of hindsight is 20/20 and that applies to almost every trade you will ever put on. Since the current position has just $80 of risk it allows me to add a new position to take advantage of the projected large move lower into Aug/Sept. In retrospect, it would have been good to add that new position yesterday but obviously nobody knew the RUT would be down 1.5% this morning. The plan is still to add another bearish RUT position to the portfolio, perhaps today. The options portfolio was already short quite a few Deltas so it would have been poor risk management to not take some risk off. Until this morning, everybody’s concern was the market continuing to grind higher.
Thank you.
You’re welcome, Ed. I appreciate your comments. It is good to have a nice dialogue going because other people may have same questions/comments. I will make many adjustments in the future that will reduce potential profitability of positions in order to reduce overall portfolio risk. That is how I have been able to stay in the game for 30+ years. I rely on Stan and Jack’s chart analysis to guide my decisions on when to add and when to reduce risk.
Paul,
Any plans to adjust the TSLA trade soon? The June credit is down to .08. Time to get more credit? On the put debit options it seems like TSLA has a long way to go to reach 200 also.
Ed, you are right about adjusting the TSLA position. What I have right now is too far gone to profit from even a big move lower. Within the next day or 2 will be getting short TSLA with a brand new position to profit from the current price level.
Paul,
Looking at a July TSLA Butterfly. Did not spend much time on it but it looks like a 10 to 1 ratio. 1.46 debit with a chance to make over 1k. They are for 21 July expiration.
+1 280 PUT
-2 265 PUT
+1 255 PUT
Ed, I like the spread but you would need an almost 11% move in the stock just to get to your long strike at 280. When I look at far out of the money (OTM) spreads I like to have as much time as possible as long as it doesn’t add too much cost. The July spread has a mark price of $1.60 and the August mark is just $.15 more at $1.75. To me, if I can get an extra month on a far OTM spread for $.15 (10%) extra I would do it every time. Make time your friend, not your enemy! I also use Stan’s cycle targets to help me choose the expiry month but even then I try to add some extra time to increase my probability of profit.
Interesting all the things you can do with Butterflys if you can get correct time and price. Looking at support areas on TSLA, like the 50 day and 38% fib at 290 for June cost .28 cents and the 285 area and 50% fib for July is .18 cents. Not bad risk reward if you can make between 200 to 400 dollars on these.
Ed, as you mentioned, a Butterfly is a very good instrument for a price/time combination because the reward/risk ratio is usually very good. Having said that, I generally push the expiry further out than what I expect that I need. That way, if price reaches the target earlier than expected I take the Butterfly off at a decent profit and if price takes longer and it reaches the price target then I have a very good profit. The Broken Wing Butterfly is more expensive but gives you a much higher probability of profit than a standard Butterfly but both types have their place in an options portfolio. One thing to keep in mind however is the commission. A minimum Butterfly has 4 contracts to get into the position and 4 to exit. If you are paying $.01 per contract then that is an $.08 round trip. Your above example of the Tesla Butterfly for $.18 means you are spending 44% of the cost of the Butterfly in commissions! Hard to overcome that drag. That is one reason why I often use them on RUT or SPX. I might be buying a RUT Broken Wing Butterfly for $5.00 or more so the $.08 of commission is a non-factor. You always have to take into account your commission costs when determining your strategies.