The Options Trading and Investing service provides perspective on high quality setups and option trading strategies. We carefully select these setups due to their quality and profit potential and we report back on results. In the weekend free webinar I review current portfolio performance and I also discuss techniques that I utilize to help reduce risk and, in some instances, lock in profits from previous trades. This week I discuss a Broken Wing Butterfly position in the E-Mini futures options as well as a new position in USO and an update to the EEM position. Finally, I update the Apple stock vs. Apple option ‘competition’ to see which strategy is performing best.
Please refer to our education video HERE for more information in the option strategies used in this post.
The entries and cost basis of new positions will appear on our private twitter feed during the coming week.
Below is the breakdown of all option positions. 
Below is my tweet from Jul 6th to The Art of Chart subscribers regarding the open Unbalanced Broken Wing Butterfly (BWB) in /ES futures options. It deals with a very important option concept when a position is nearing expiration.
On July 7th I tweeted out the updated risk profile after I sold the 2440/2430 Put Vertical Credit Spread for a credit of $9.50. When I originally designed the position I did so when the intention of structuring it to allow for rolling the 2440 put down to a 2330 put and still have an equal amount of risk/reward on both sides of the spread. Since the original position cost $5.00, taking in a credit of $9.50 guaranteed that I could do no worse than make a $4.50 ($450) profit on the position. How did I decide on a $9.50 credit? The max value a $10 wide spread has is $10. It can never be worth more than that and, in reality, never really trades at full value. Without any regard for where I thought /ES was headed that day for me to be able to collect 95% of the value of a spread is a no brainer. In fact, I often leave a resting order in the system to collect 80% – 85% of any spread because I would be reducing risk by 80% – 85% while only reducing the profit by 15% – 20%.

This was my final tweet of the day regarding this position. I have to correct myself on this tweet as I said “I have taken $1,450 in profits on BWB”. I did take in $1,450 in cash however the original cost of the position was $500 so the profits were actually $950 ($1,450-$500). At the time of the tweet I had one extra bonus, I still owned the 2410 puts. If /ES had closed down below the 2410 strike those also would have had some value but, as it turned out, they expired worthless. All in all it was a good trade; $950 profit on $500 of risk for a 190% profit in 14 days.

Current position in EEM is shown (below). This position has been underwater for over 4 months now as the move higher exceeded both initial time and price projections. Because I established the initial position back in February with a very long duration it has allowed me to be wrong and still be in the trade. Now, after all that time being down, I am in the position of needing less than a 3% move lower over the next 2 weeks to get back to break even. If EEM closes about 5% lower on Jul21 expiry the position will go from being down $783 currently to a profit of $760. That would be an improvement of $1,543. Notice the Theta in the position if EEM moves lower in price. If EEM were to make an immediate 5% move lower the position would improve by about $580, far less than the $1,543 I just mentioned. What accounts for the additional $963 of profits? Theta!!! I attempt to make most of the portfolio’s position benefit from Theta (time) and Delta (direction). The primary position, which is the longer term component of an overall position, is based on Stan’s long-term price and time projections If Stan makes a change in the primary projection or he sees a short-term opportunity I can adjust the position to match up with the targets. Other times I will adjust just because I have an opportunity to use the primary position as ‘cover’ for a new position. The goal is almost always an attempt to add greater amounts of Theta to my positions.
This is just the adjustment position in EEM that was part of the overall position on the last slide. You can see that the upside risk in adding this position was just $65 whereas it added as much as $935 of potential profit. The biggest risk to this position, a Put Ratio Spread, was a large, quick move lower soon after I initiated the position because there is undefined (unlimited) risk to the downside. However, the September position would have had a large profit on a move to the downside so that was what I was referring to on the previous when I said the primary position was ‘covering’ the new position. Now that 10 days has passed since I added this position, the current profit/loss line (CPL) is sloping upward and to the left so it doesn’t need to be covered anymore, it can stand on it’s own. In fact, there is a possibility that I may be able to sell a little more premium this week to eliminate the upside risk altogether. 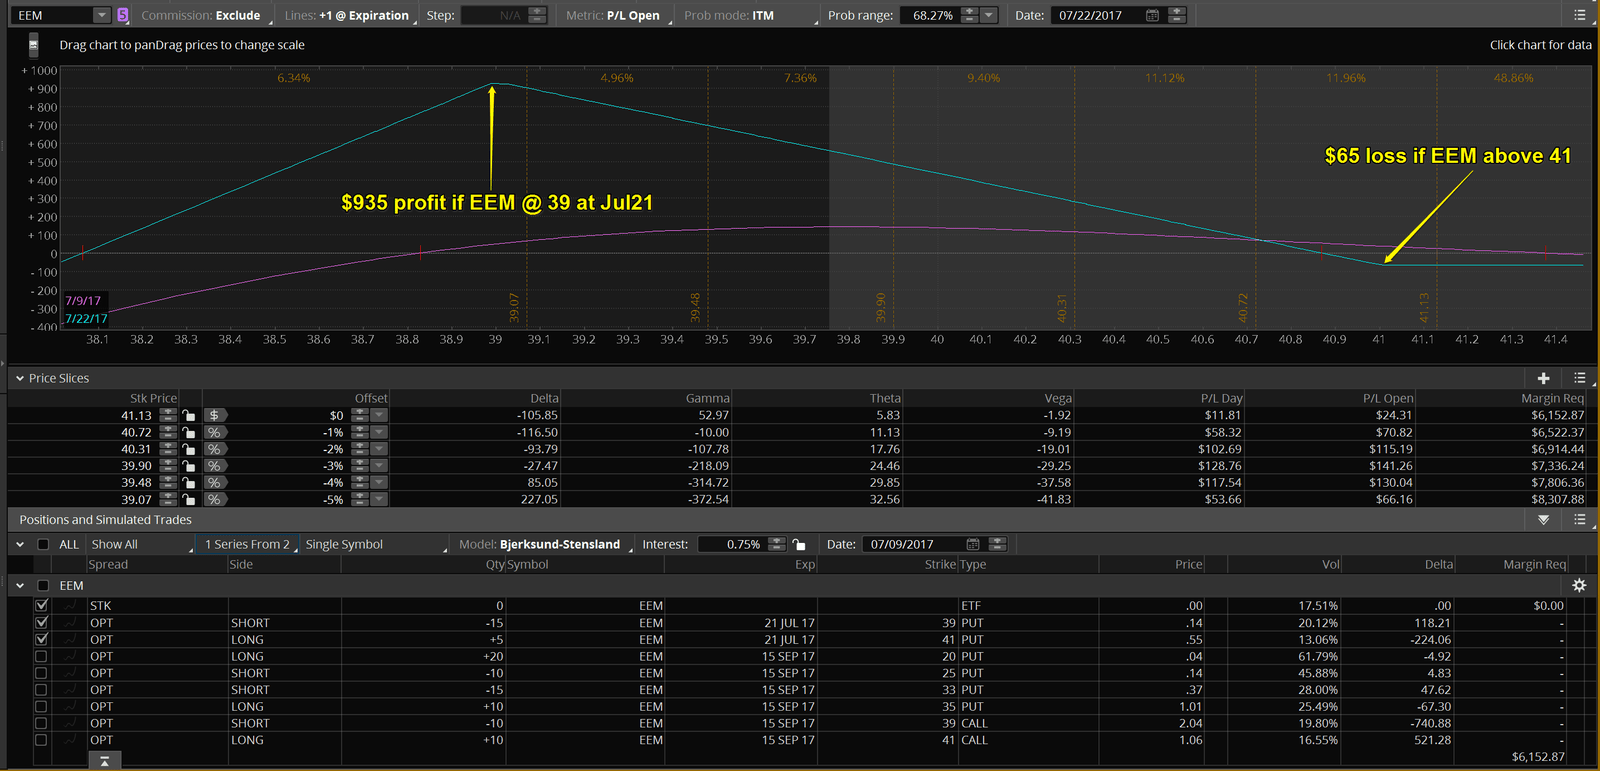
Below is the newest position in USO (below). This is a Ratio Diagonal Spread. All experienced option traders are familiar with Diagonal spreads and most are familiar with Ratio spreads but very few combine the 2 strategies. Option traders are usually discouraged from selling in the money (ITM) options because anytime you are short ITM options you are subject to being assigned the shares in the underlying instrument. I utilize them as part of a spread when I want the position to be very directional (Delta) with a relatively large amount of Theta. This position was added when Stan felt a large move lower was imminent in oil. When I sold the Jul28 USO 9 calls they were almost $.50 ITM. However, after oil did move significantly lower in just a couple of days, the calls are now just $.10 ITM. The directional component of the trade has already paid off and even if USO doesn’t go any lower in price, the position’s profit will rise from $105 to $650 over the next 19 days. Think about this: the position could add $545 of Theta in the next 19 days if USO is relatively unchanged over that time. That is $28.68 per day. That equates to $10,470 in Theta over a year on a position using $2,586 in margin. That is for nothing happening in the price of USO! This is a good example of combing Delta and Theta to maximize the profitability of a position.
Below is the current position in AAPL. It is a long-term Stock Replacement Strategy that deserves a place in any of my option portfolios. Why do I call it a stock replacement strategy? What advantages does it have over simply buying the stock? As you can see below, the position is profitable as long as AAPL’s price is below $158.34. There is no risk to the downside. That feature is not available if you purchase the stock. This position doesn’t benefit from a large, immediate move higher like owning the stock does. That has been the big advantage to owning the stock over the past year. Will that continue? Stan doesn’t project that to continue in the Big Five Chart Service view of AAPL. If you are not a subscriber consider the 30 day free trial to see where he and Jack think AAPL (as well as NFLX, AMZN, FB, TSLA) is headed over the next year.
On June 11th I began keeping an updated comparison of how this strategy has performed in comparison with owning the stock so we can all see how it is working. The option position I established used up $5,000 of margin. For that amount of margin, I could have instead bought 72 shares of AAPL stock at $139.79 on 3/1/2017. On 7/7/2017, AAPL closed at $144.18/share. If I had bought the stock my profit would be $316.08. The option position currently has a gain of $321.50. That means that the option position has out-performed the stock purchase by $5.42.
This was the question I asked on the June 11 webinar when the stock position was out performing the option position by $918.68: If I was allowed to switch positions and take the stock position and the open profit but I had to hold whatever position I owned through Jan2018 expiry, would I make the switch? My answer? Not a chance! As we get closer to Jan2018 it will become obvious if I made the right decision.
What if the price of AAPL on Jan19, 2018 is the same as the current price($144.18/share), what will the stock and options positions be worth then? The stock will still maintain it’s current $316.08 gain plus accrue $136.08 in dividends for a total stock profit of $452.16. The option position will have a total option profit of $2,750. The option position will out-perform the stock position by $2,297.84 by Jan 19, 2018 if AAPL’s share price then is the same as the current price. 
Consider the AAPL position I just discussed. I established the position when AAPL was trading at $139.79 on 3/1/2017. To be profitable, AAPL could trade higher or lower or unchanged but the area where the position would lose at expiry was above $158.34. The area where the trade would be unprofitable immediately after the position was established was any price higher. In other words, the position was short-term bearish and long-term neutral to bullish. So what happened after I established the position? Of course the stock moved against the position and traded as high as $156.65 on 5/15/2017. Any bearish to neutral short-term (less than 60 days) strategy gets blown up and takes a loss as it expires. With this position I was able to ride out the storm and keep the position which has now turned profitable.
So what about the short-term traders? You can still be a short-term option trader and utilize longer-term option positions. Let’s look at the week of 6/12 – 6/16 in AAPL with the Jan2018 position that I own in the portfolio. Let’s say I felt AAPL was going to have a bad week and I wanted to take advantage of that. What if I didn’t already own my current position and I initiated it just before the close on Friday, 6/9/2017. So the stock drops by 4.5% but the option position would have had a $600 profit in one week which is a 12% profit on $5,000 margin requirement. If I was a short-term trader I could have closed the position 6/16 and booked the $600 profit. Now, if I knew that AAPL was going lower that week I could certainly have used a much more profitable short-term strategy instead but the problem is nobody knew what the price of AAPL was going to do last week. Stan estimates that good chart patterns play out about 70% of the time which is a huge advantage in trading however no one should take that to mean 100% certainty! Art of Chart option trading is about maximizing the range of profitability that you can get with longer-term positions while incorporating Stan and Jack’s price and time targets to reduce the cost basis of entering the positions. This method will produce slower profits but fewer losses and, over time, more consistent profitability with lower trading costs.
That is all for this week. If you have questions or comments you can post them here on the blog or if you are an Art of Chart subscriber you can post it on the private Twitter feed. If you are not a subscriber you can sign up for a 30 day Free Trial to try out the service. What have you got to lose, it’s free!
 09th Jul 2017
What is the strategy of buying back the TLT calls? Expect TLT to go higher?