The little retracement yesterday made the targets on the 60min sell signals on ES and NQ and denied SPX a record on the number of consecutive all-time highs at the start of a year. However, it is likely that in a week or so SPX will complete the longest ever period without a 5% retracement.
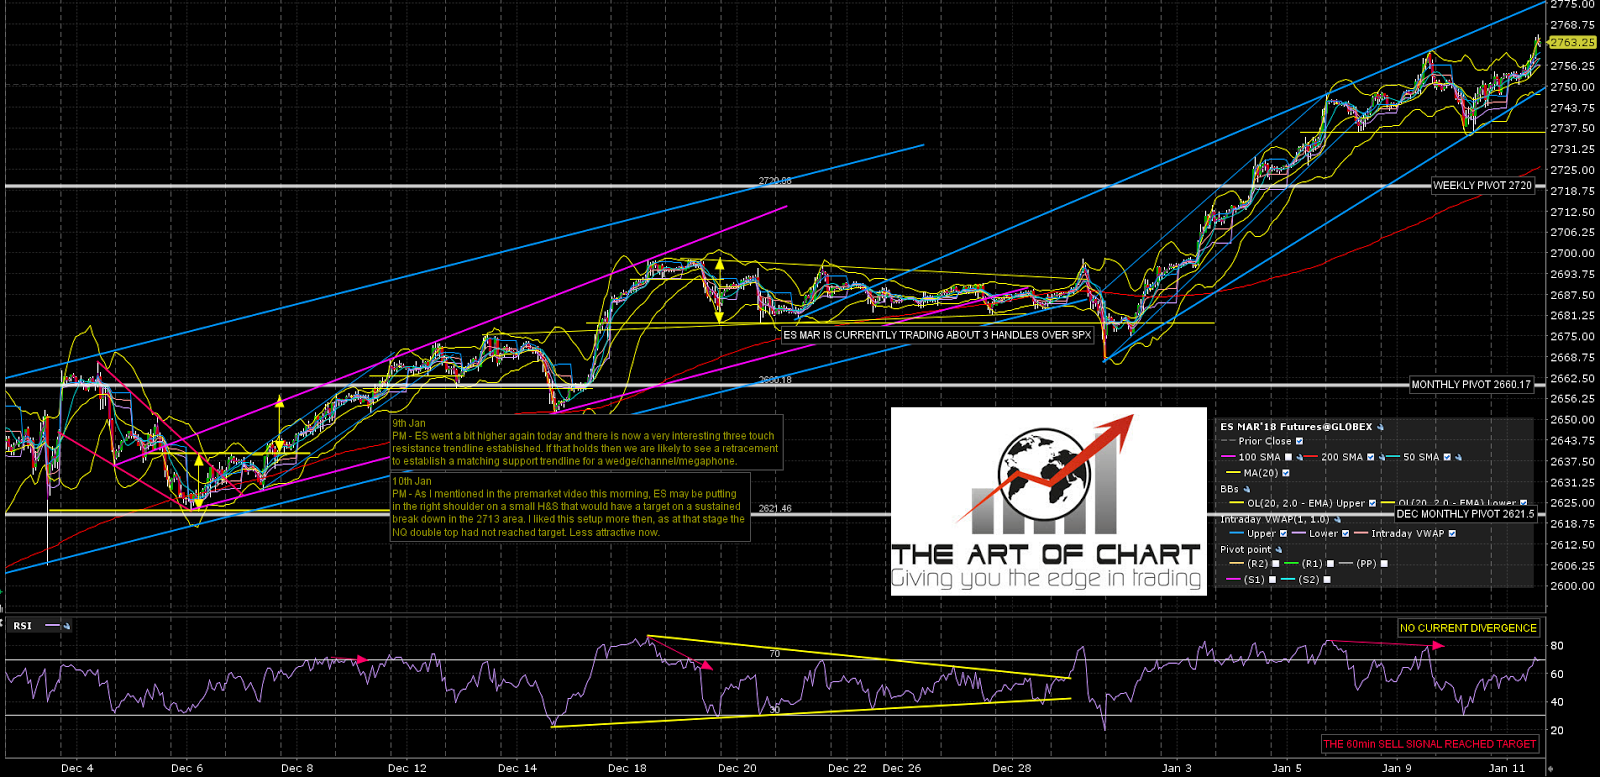
A decent three-touch resistance trendline was established on ES on Monday, and I was looking for yesterday’s retracement to establish a corresponding support trendline. That is now done and I have a working rising wedge on ES with wedge resistance now at 2775 if ES can clear Stan’s resistance in the 2775 area. NQ and TF both also looking interesting and I cover all three in the video.
Intraday Video – Update on ES, NQ, and TF:
Here is the rising wedge, and it’s a decent pattern. We’ll see how it does. Rising wedge support is now at 2749. ES Mar 60min chart:
Stan and I are doing a free educational webinar an hour after the close tonight at the theartofchart.net looking at translating technical analysis into profitable trades. If you’d like to attend, you can register for that here.
 11th Jan 2018