I try to post a full video once a week, so I’m posting one today. If you’re just interested in the equity indices, I cover those at the start of the video. Stan and I are doing two free webinars tonight: the first is on trade execution 30 minutes after the RTH close, and the second is on the big five stocks and sector ETFs an hour after the close. If you’d like to see either or both you can register for those on our February Free Webinars Page. Full Intraday Video from theartofchart.net – Update on ES, NQ, and TF ….. and CL, NG, HG, GC, ZB, KC, SB, CC, ZW, DX, EURUSD, GBPUSD, USDJPY, USDCAD, AUDUSD, and NZDUSD:
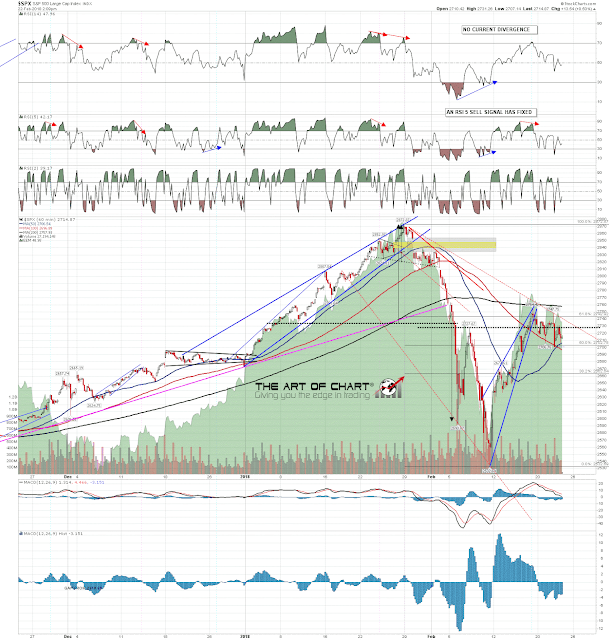
SPX has rallied back to test the daily middle band again today and rejected there again so far. As long as that remains the case then the likely next leg down has started, though confirmation of that only comes with the break and conversion of 2700 to resistance, which we are still waiting for. If SPX should break and convert the daily middle band then we would likely see the rally high retest that we didn’t see yesterday, and bears would then need to deliver a rejection candle back below the middle band tomorrow. We shall see 🙂 SPX 60min chart:
 22nd Feb 2018