In our Sunday Chart Chat, I was looking at an attractive scenario for this week where ES/SPX would make a higher high this week to complete a possible IHS forming, break up slightly from that, and then fail back into a minimum target at last week’s low at 2553.80, also the target on the Three Day Rule triggered by Friday’s clear break back below the 5dma on SPX.
What is a Janus Flag? It is a bull or bear flag that looks like a reversal pattern forming, breaks up (or down) and then rejects hard into a retest of the previous low (or high).
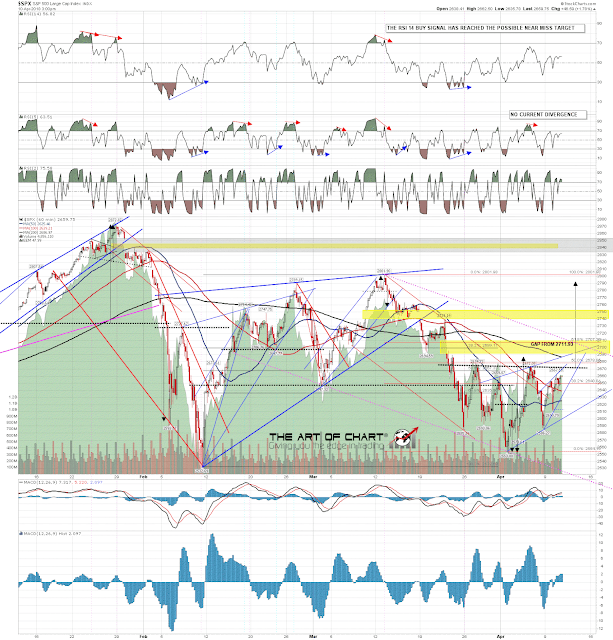
I’ve explained in detail how I see this setup, and given a likely Three Day Rule invalidation level at a fill of the open gap from 2711.93. Full Intraday Video from theartofchart.net – Update on ES, NQ, and TF (at the start) and then DX, CL, NG, GC, ZB, HG, KC, SB, CC, ZW, EURUSD, GBPUSD, USDJPY, USDCAD, AUDUSD, and NZDUSD:
The open breakaway gap from 2711.93 is shown on this SPX 60min chart below, as well as the part formed IHS. If the IHS was to break up and make target, then that target would be in the 2790-5 area. SPX 60min chart:
Stan and I are doing our monthly free public Chart Chat on Sunday, and on Thursday after the close, we will be doing our monthly free public review of the Big Five and Sectors. If you’d like to register for either or both, you can do that on our April Free Webinars page.
 10th Apr 2018