I was saying on my twitter yesterday that if ES could break and convert to support weekly pivot at 2842 then ES/SPX could head up directly, but in the absence of that a test of 2800 area support was likely, and well, here we are. So what now?
Well there is decent established support in this area down to 2793 on ES, and that may hold. A break slightly lower gives a test of the monthly pivot at 2788. A break and conversion of monthly pivot to resistance would be a significant bearish break of a kind that we haven’t yet seen in this retracement. ES Sep 60min chart:
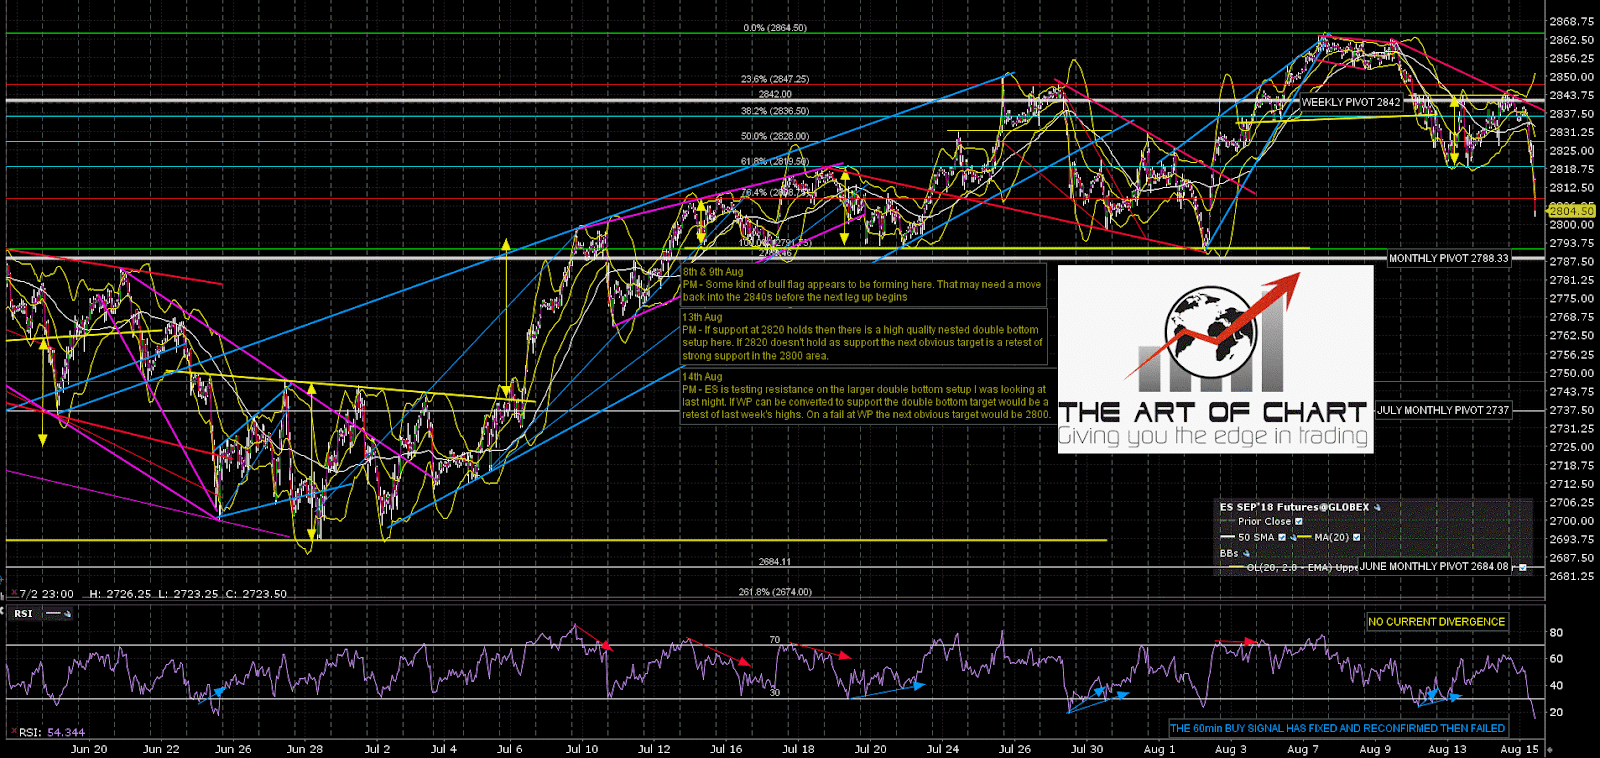
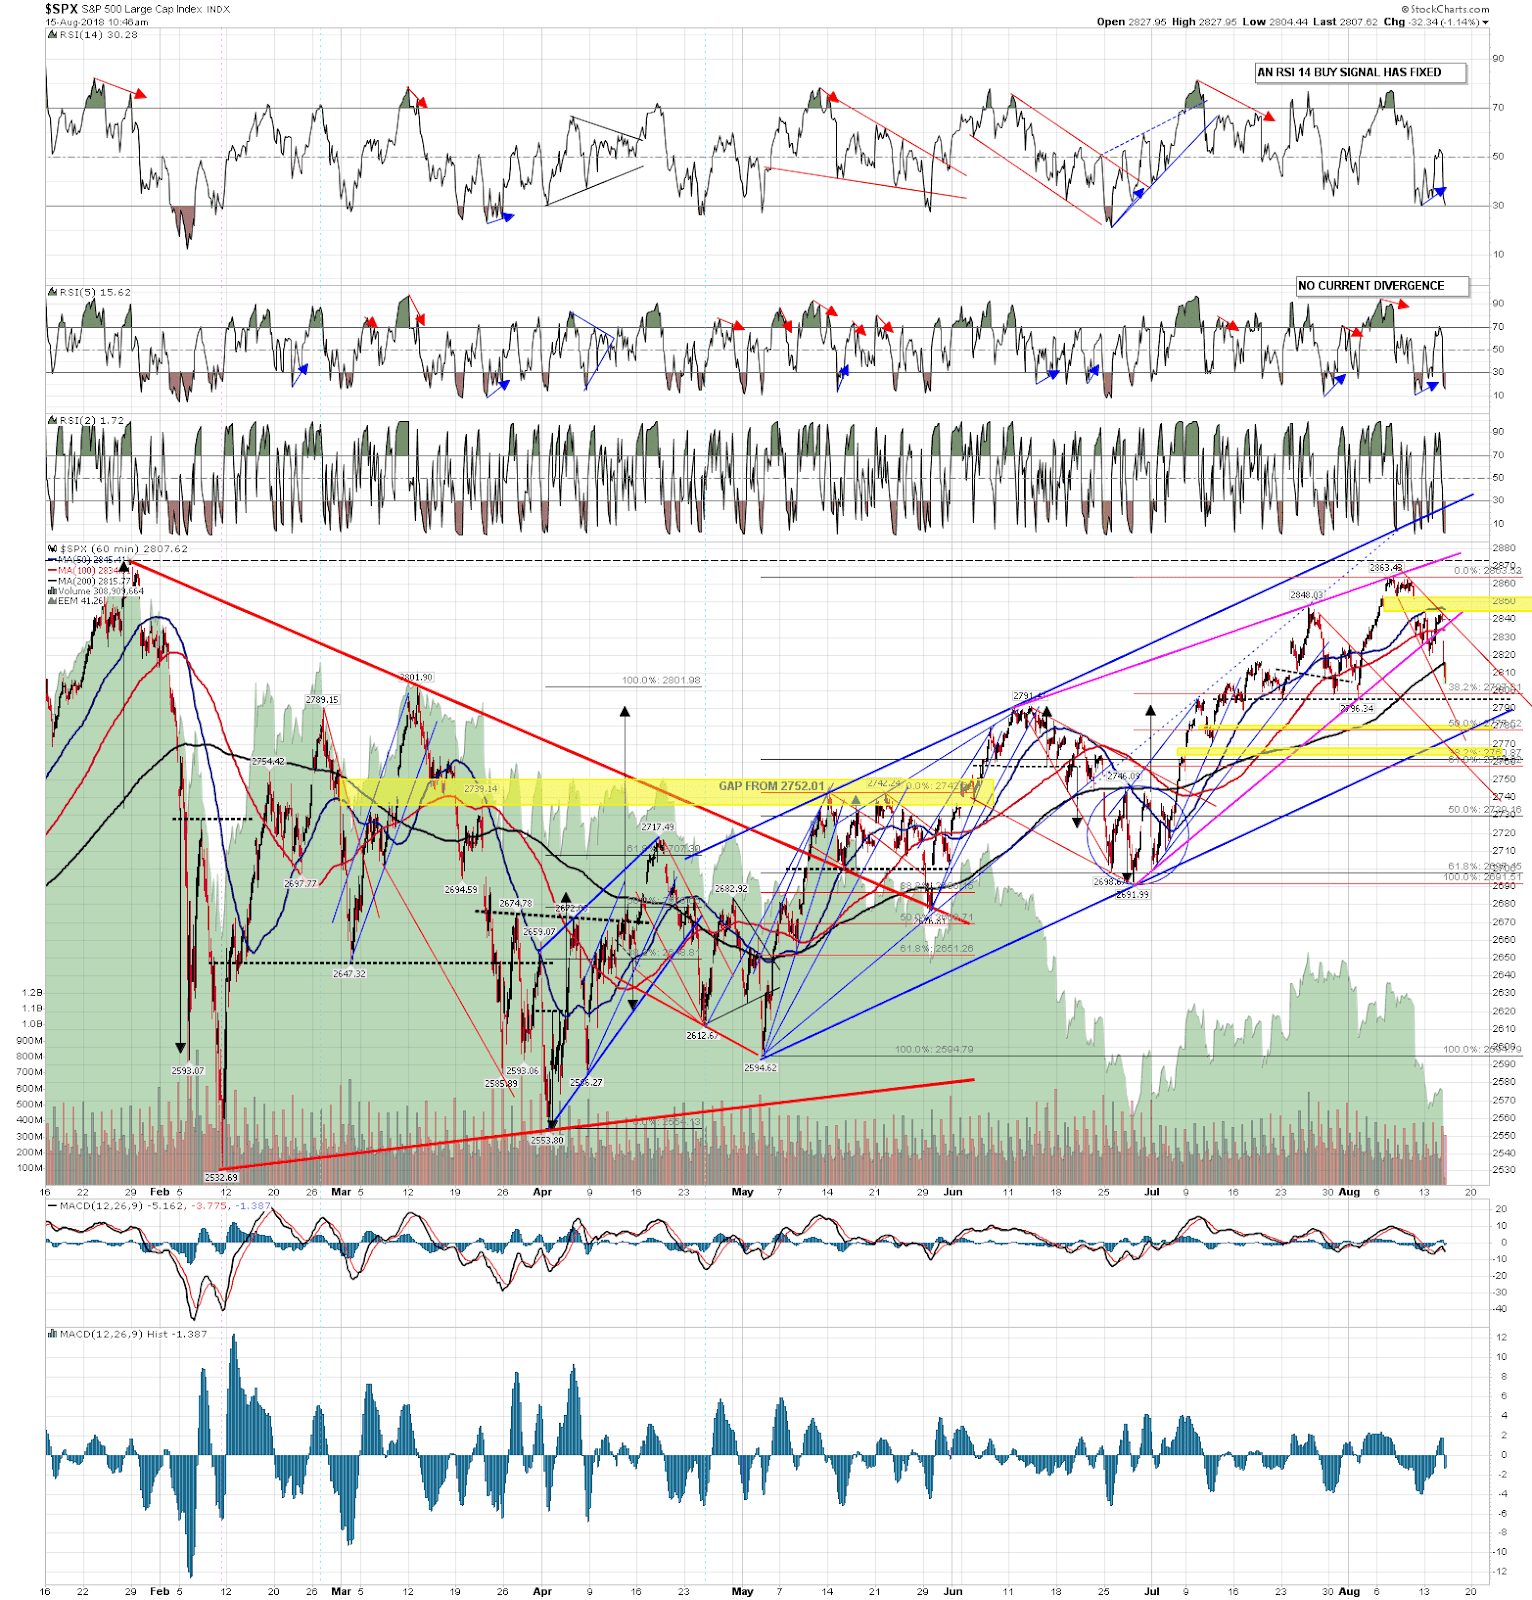
Not far under the ES monthly pivot test is a very important trendline at current main rising channel support now in the 2770-5 area. A test and reversal there would mean that this rising channel has evolved into a rising wedge. A sustained break below would open more downside. SPX 60min chart:
I have to be out most of the rest of RTH today but I’ll be watching with interest from my phone. If we find a low today then I’d note that Thursday and Friday this week are both cycle trend days, so we could see a strongly directional days tomorrow and/or Friday.
 15th Aug 2018