After repeated tests where it held, the thrust down after the Fed hike on Wednesday broke down through the big support level and potential H&S neckline in the 2530-40 SPX area and continued down. Wednesday night I was looking at the next big level on ES 2465-80 area and that too has broken yesterday. I’d be surprised not to see a strong counter-trend rally on SPX soon but it’s getting harder to identify where the next decent support might be.
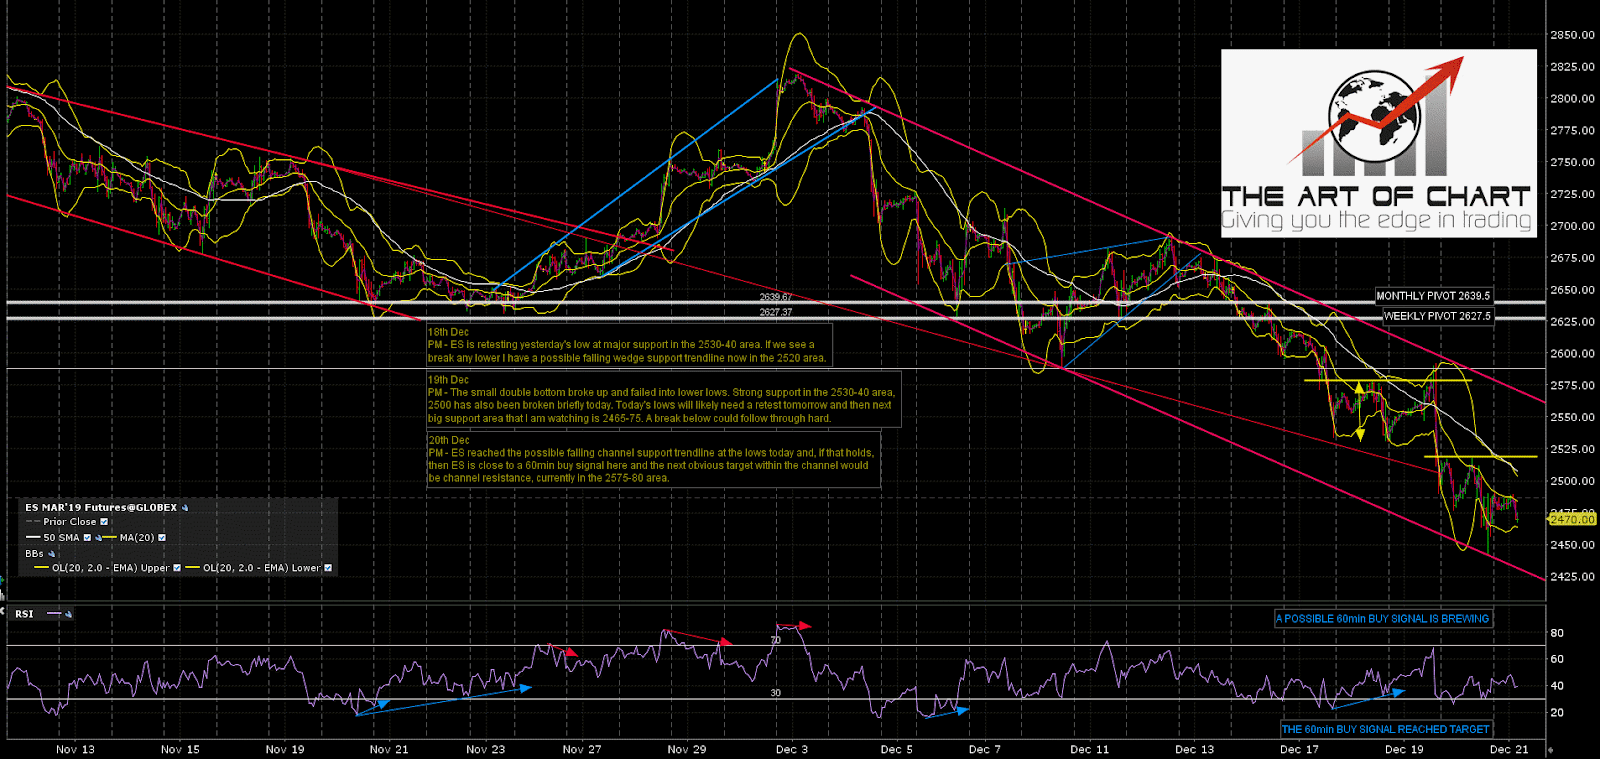
Short term though, the ES low yesterday was an exact test of the possible falling channel support trendline that I had drawn in on my ES chart and, as long as that trendline remains unbroken, the obvious next target within the channel would be a test of channel resistance, currently in the 2570 area.
ES Mar 60min chart:
There are some things to bear in mind here on the bigger picture. Firstly, in the event that 2530-40 SPX was not going to be an H&S neckline, then the alternative was that it was double top support. That support has now broken down with alternate targets at either the 2200 area or the 2120 area, and my working assumption is one or both of those levels will be tested in 2019 as this move plays out. Large H&S patterns have now also broken down on both NDX and RUT, following the very high quality H&S on DAX which I’ve been watching form for much of the year and which broke down first.
I’d note possible support at rising megaphone support from the 2011 low is now in the 2300 area, and rising support from the 2009 low is now in the 2200 area, currently a decent match with that higher double top target. On a break below megaphone support in the 2300 area then I would be watching the 38.2% retracement of the move up from 2009 in the 2225 area, the 50% retracement of the megaphone in the 2000 area and the 61.8% retracement of the megaphone and the 50% retracement of the move up from 2009, both in the 1800 area. If we do see a decent rally start from the current area, which I’m thinking is likely, then an obvious target would be a backtest of the monthly middle band, now in the 2650 area. A weak rally would just be a backtest of broken double top support at 2532.
SPX monthly chart:

Stan and I are doing our annual free public webinar looking at the year ahead at 5pm EST on Sunday 30th December. All are welcome and if you’d like to attend you can register for that here. We will be looking at the usual very wide range of markets including equity indices, bonds, forex, precious metals and commodities.
Our usual end of year sale on annual subscriptions has started and as well as the usual free two months discount on these subscriptions there is a further two months (20%) off through to January 2nd. Our price guarantee as always is that as long as any subscription is continuous the price will never be raised on any product for any current subscriber. The sale code is XMAS 20 and the subscription page is here.
I’ll be working next week so there will likely be another post out before then. Until then though, everyone have a great Xmas/holiday. 🙂
Richard Chappell aka Springheel Jack has been writing about equity, bonds, forex and commodity market at channelsandpatterns.net since 2010, and also at theartofchart.net since 2015. He is co-founder of theartofchart.net, producing charts and videos every day for subscribers there, as well as numerous charts and videos for wider audiences.
 21st Dec 2018