SPX went up through both of the annual pivot and 50dma resistance levels and has come close to a test of declining resistance from the all time highs, now in the 2690 area. I was talking earlier this month about the vital importance of monthly closing resistance at the monthly middle band, now at 2664. In the event that there is a clear close in January back above it, then the odds would strongly favor a retest of the all time high before there was anything more than a marginal lower low on SPX. The last time there was a significant monthly closing break back over the middle band in a possible bear market without such an ATH retest coming next was over 60 years ago.
SPX monthly chart:

The initial rally patterns have broken down, except perhaps on DAX, and SPX/ES is now in an inflection point where it either breaks down at least into the high 2500s, or retests the rally highs, probably to make the second high of a double top. I talk about that in detail on the video below, recording at lunchtime today.
Full Intraday Video from theartofchart.net – Updates on ES, NQ, RTY, DAX, ESTX50, SPX, NDX, RUT, CL, NG, GC, SI, HG, ZB, KC, SB, CC, ZW, ZC, ZS, DX, EURUSD, USDJPY, USDCAD, AUDUSD:
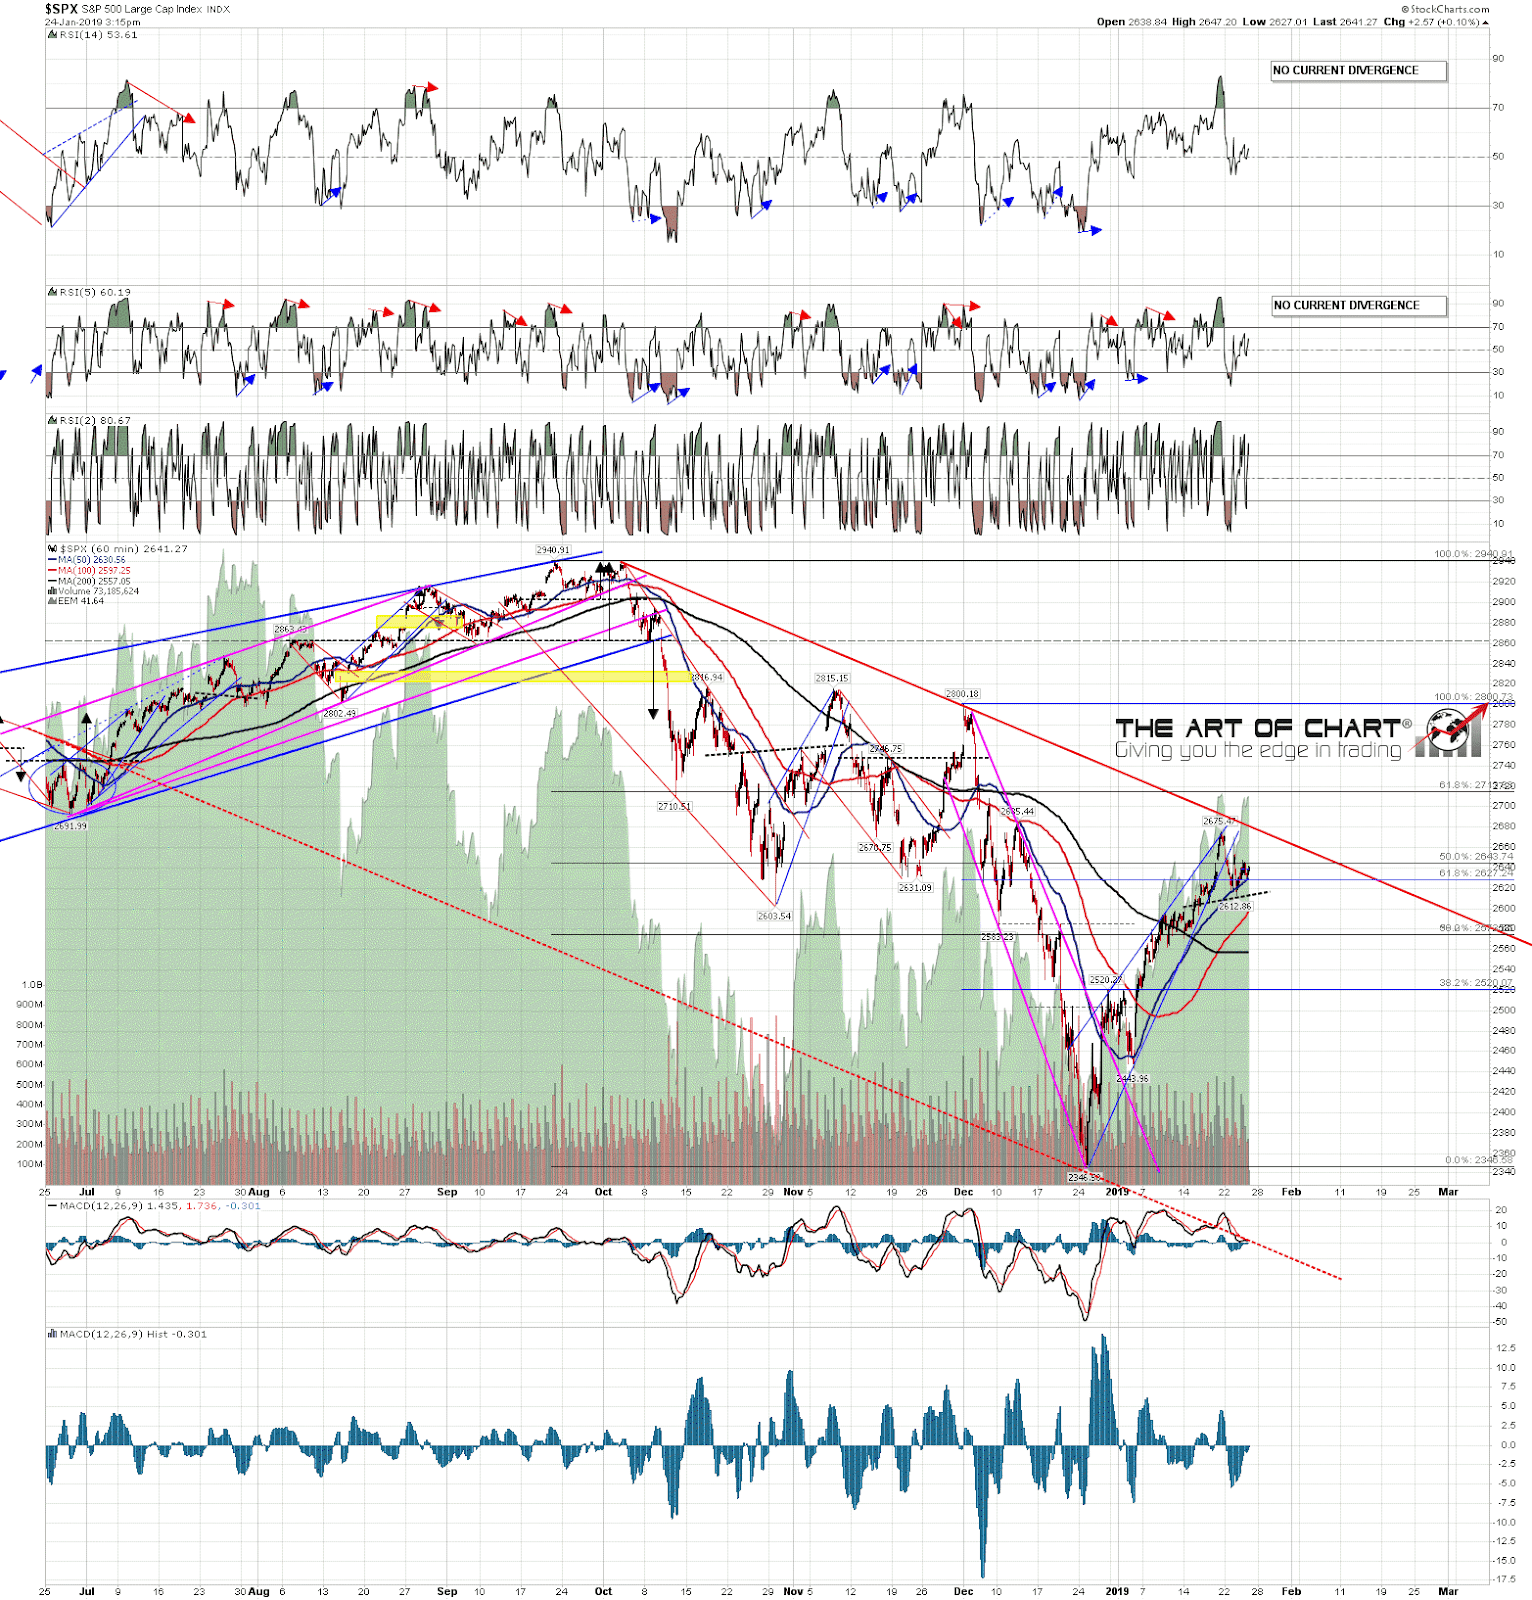
Short-term support is at the 50-hour moving average, always a significant short term trend support/resistance level, now at 2630. If that converts to resistance then that opens the test of 2600 next. If SPX breaks up instead, then a marginal new rally high would also deliver, at the moment, a possible test and fail at declining resistance from the all-time high. If we haven’t seen a break down by tomorrow lunchtime, then I’ll be leaning towards that high retest.
SPX 60min chart:
Stan and I are doing a free public webinar an hour after the close tonight looking at AMZN, AAPL, FB, GOOG, NFLX, TSLA and also the sectors ETS, IBB, IYR, XLE, XLF, XLK, XRT. If you’d like to attend you can register for that here.
 24th Jan 2019