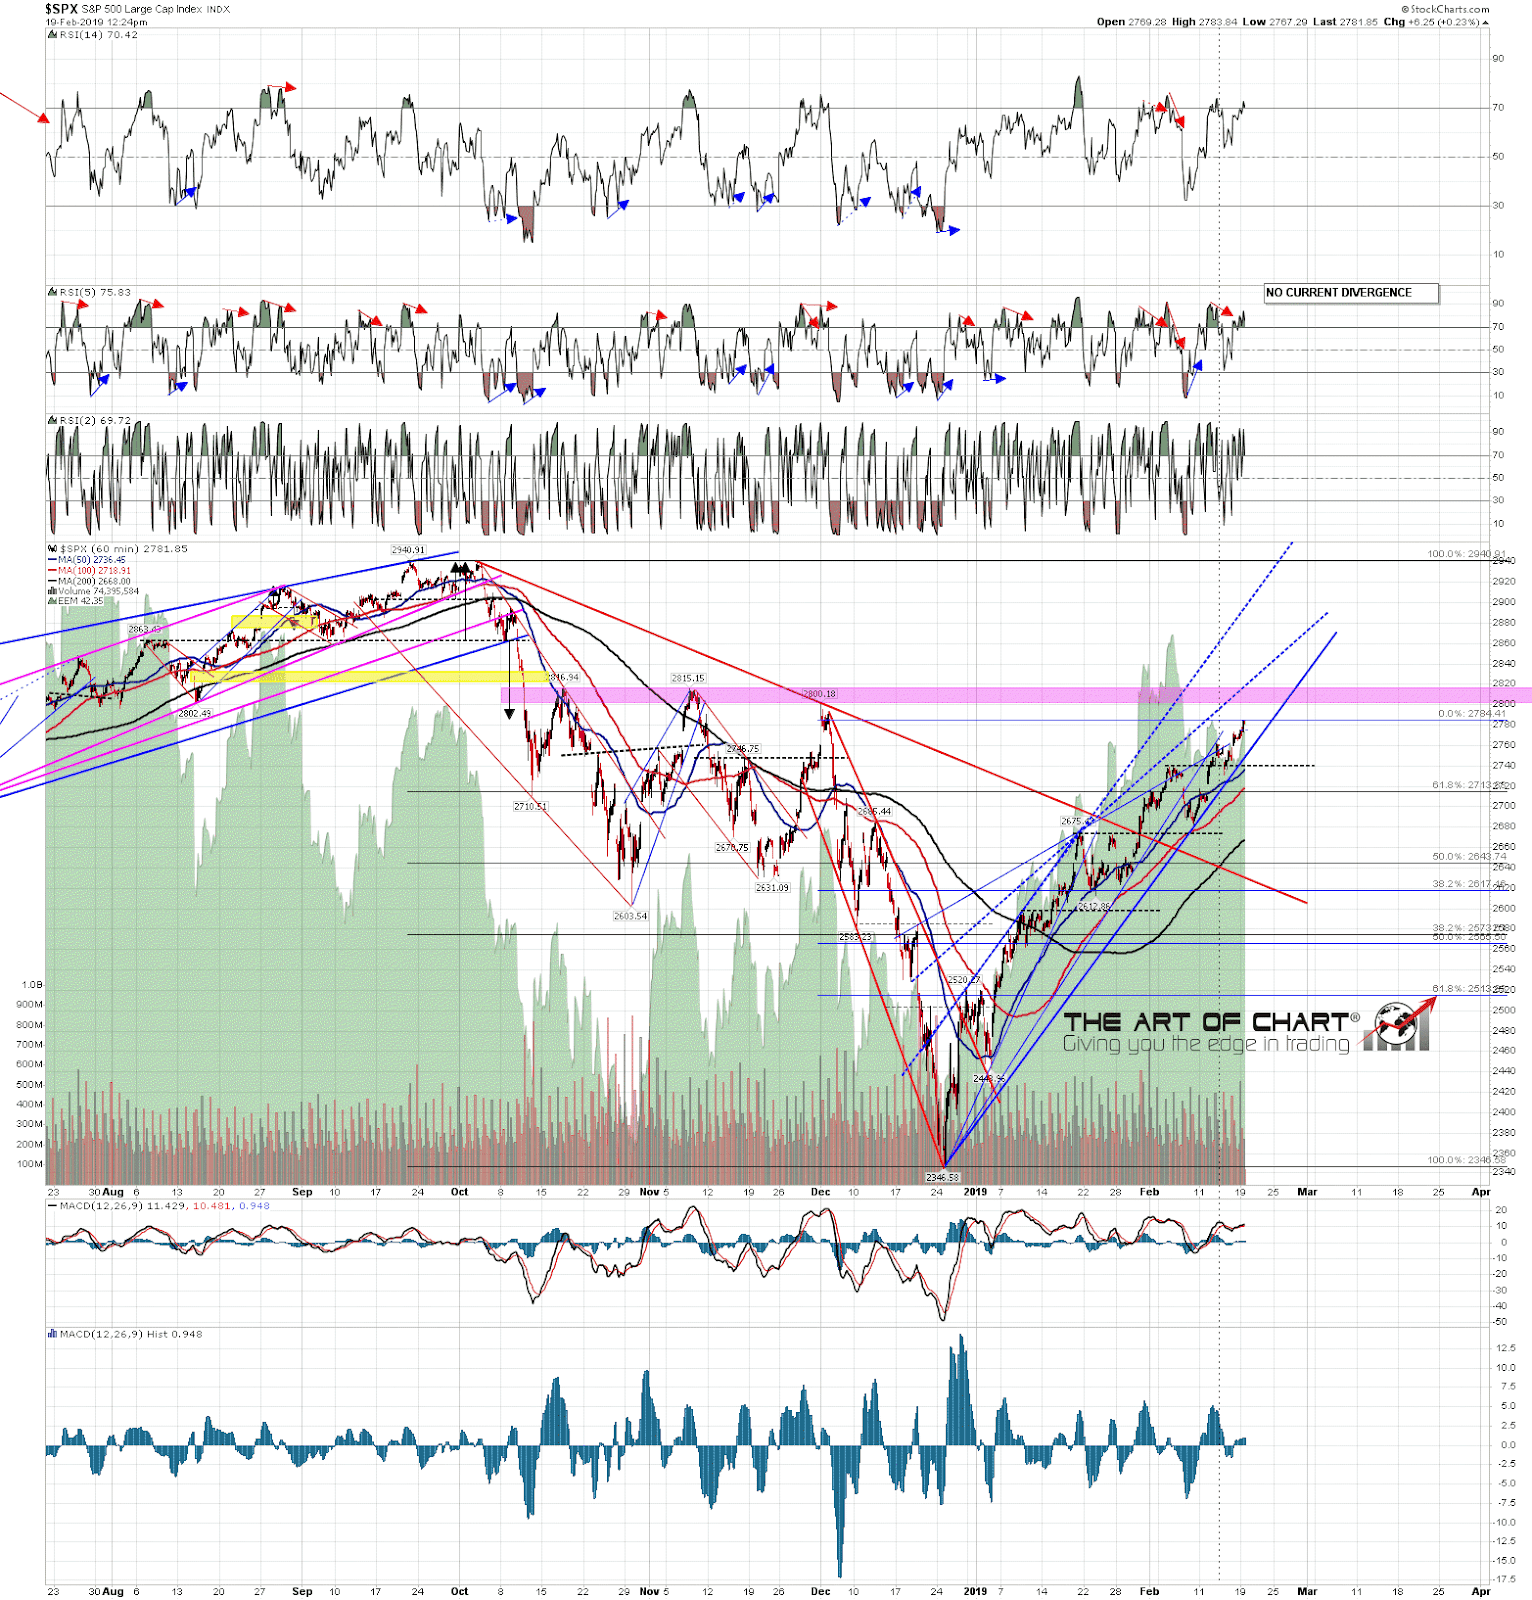
If you read my post on Friday talking about the rising channel on SPX that could deliver an all time high retest within weeks, then you know what I see as the key support level on SPX and that is of course that rising channel support trendline, now in the 2750 area and rising at about 42 handles per week. Until that breaks there’s really not much to talk about on the short side on equity indices.
I would note the resistance area above that is the last really significant resistance area before a retest of the all time high. That area is the ceiling established by three rallies Oct-Nov last year and those three highs were all in the narrow range 2800-17. A break and conversion of that area clears the way for the possible all time high retest that may be coming soon, and SPX is now getting close to retesting 2800.
SPX 60min chart:
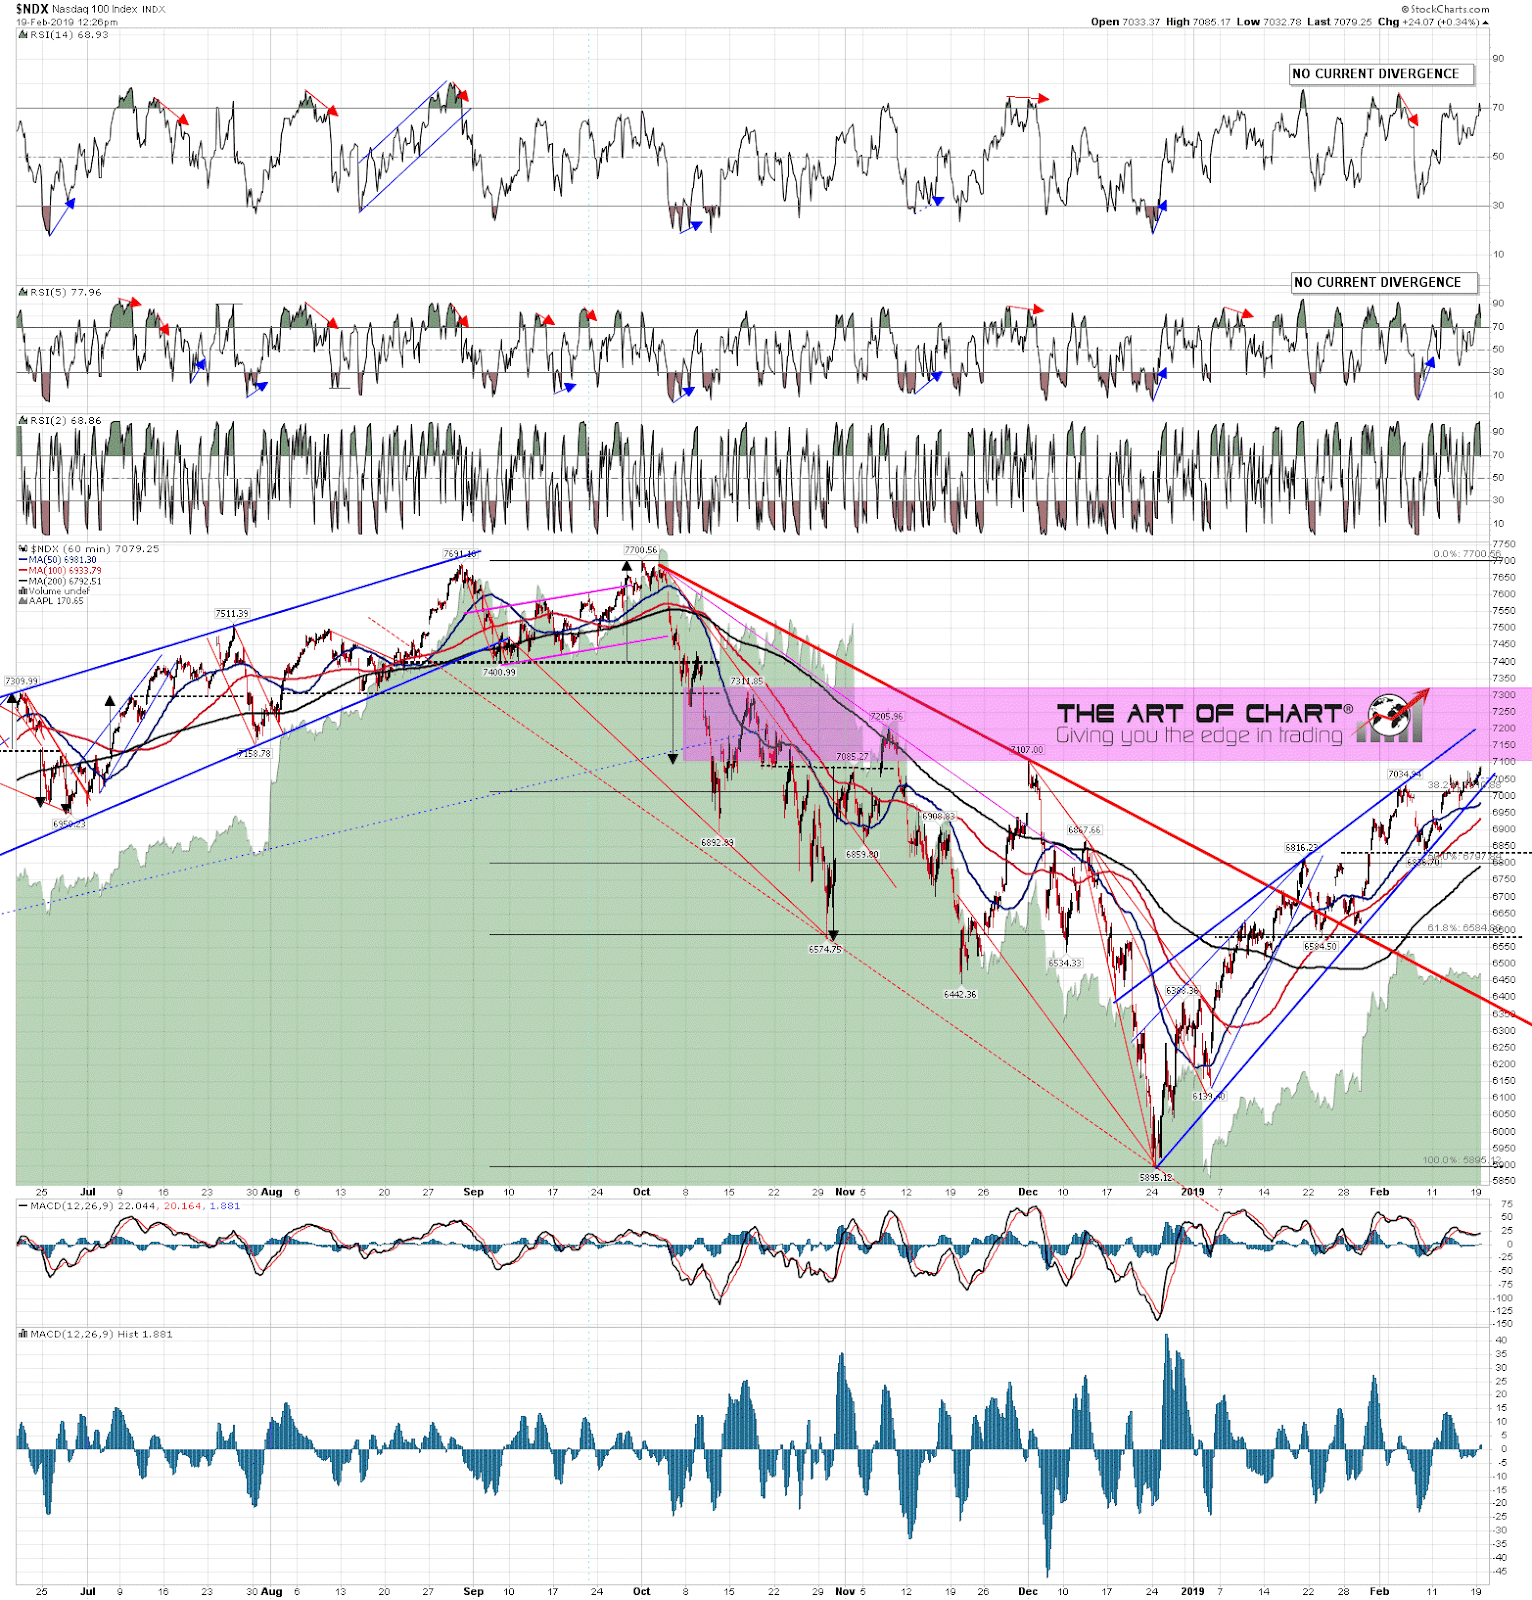
The rally on NDX has been more muted, and NDX is still trying to break over the 200dma, currently at 7055. I have NDX in a high quality rising wedge here, with wedge support now in the 7020 area and wedge resistance now in the 7210 area. The Oct-Nov three high resistance area on NDX is wider than the equivalent on SPX at 7107-7312 and, like SPX, NDX is also getting close to testing it.
NDX 60min chart:
The bull market on equities is rather long in the tooth though, and whatever happens here the upside from where we are now looks limited compared to other markets that have not been in a bull market for the last ten years. Stan and I are doing a webinar after the close on Thursday looking at the prospects across the many commodities markets we chart and there are some potentially very promising bull markets starting on several of those. One of the markets we will be looking at then is coffee.
Coffee has been in a long bear market from the 2001 high, and on the Bloomberg Coffee subindex shown below has lost about 85% from the bull market high to the possible bear market low we are looking at here. That’s not untypical as a decline in this sector, sugar has declined just under 80% and wheat a bit more than 90%. We will be looking at those and others as well on Thursday.
In terms of coffee though, the recent low retest has set up some very decent positive RSI divergence on the monthly chart, and if support is found here then this is a strong candidate for the bear market low. I would draw your attention to the little double bottom setup highlighted in yellow on this chart before I move onto the next one.
BCOMKC monthly (Bloomberg Coffee Subindex):

JO is the Bloomberg ETN and while it is only just over a year old, it is the largest coffee ETF, and you can see has been tracking very well against the coffee index prices so far. On the JO daily chart the little double bottom setup highlighted on the chart above could have an entry here at 36 (and change), and would have a target in the 58 (and change) area. This is likely to be one of the most interesting trades of 2019-20 in my view, and the prospective returns obviously dwarf anything that can be easily envisaged on equities in that timeframe. JO daily:
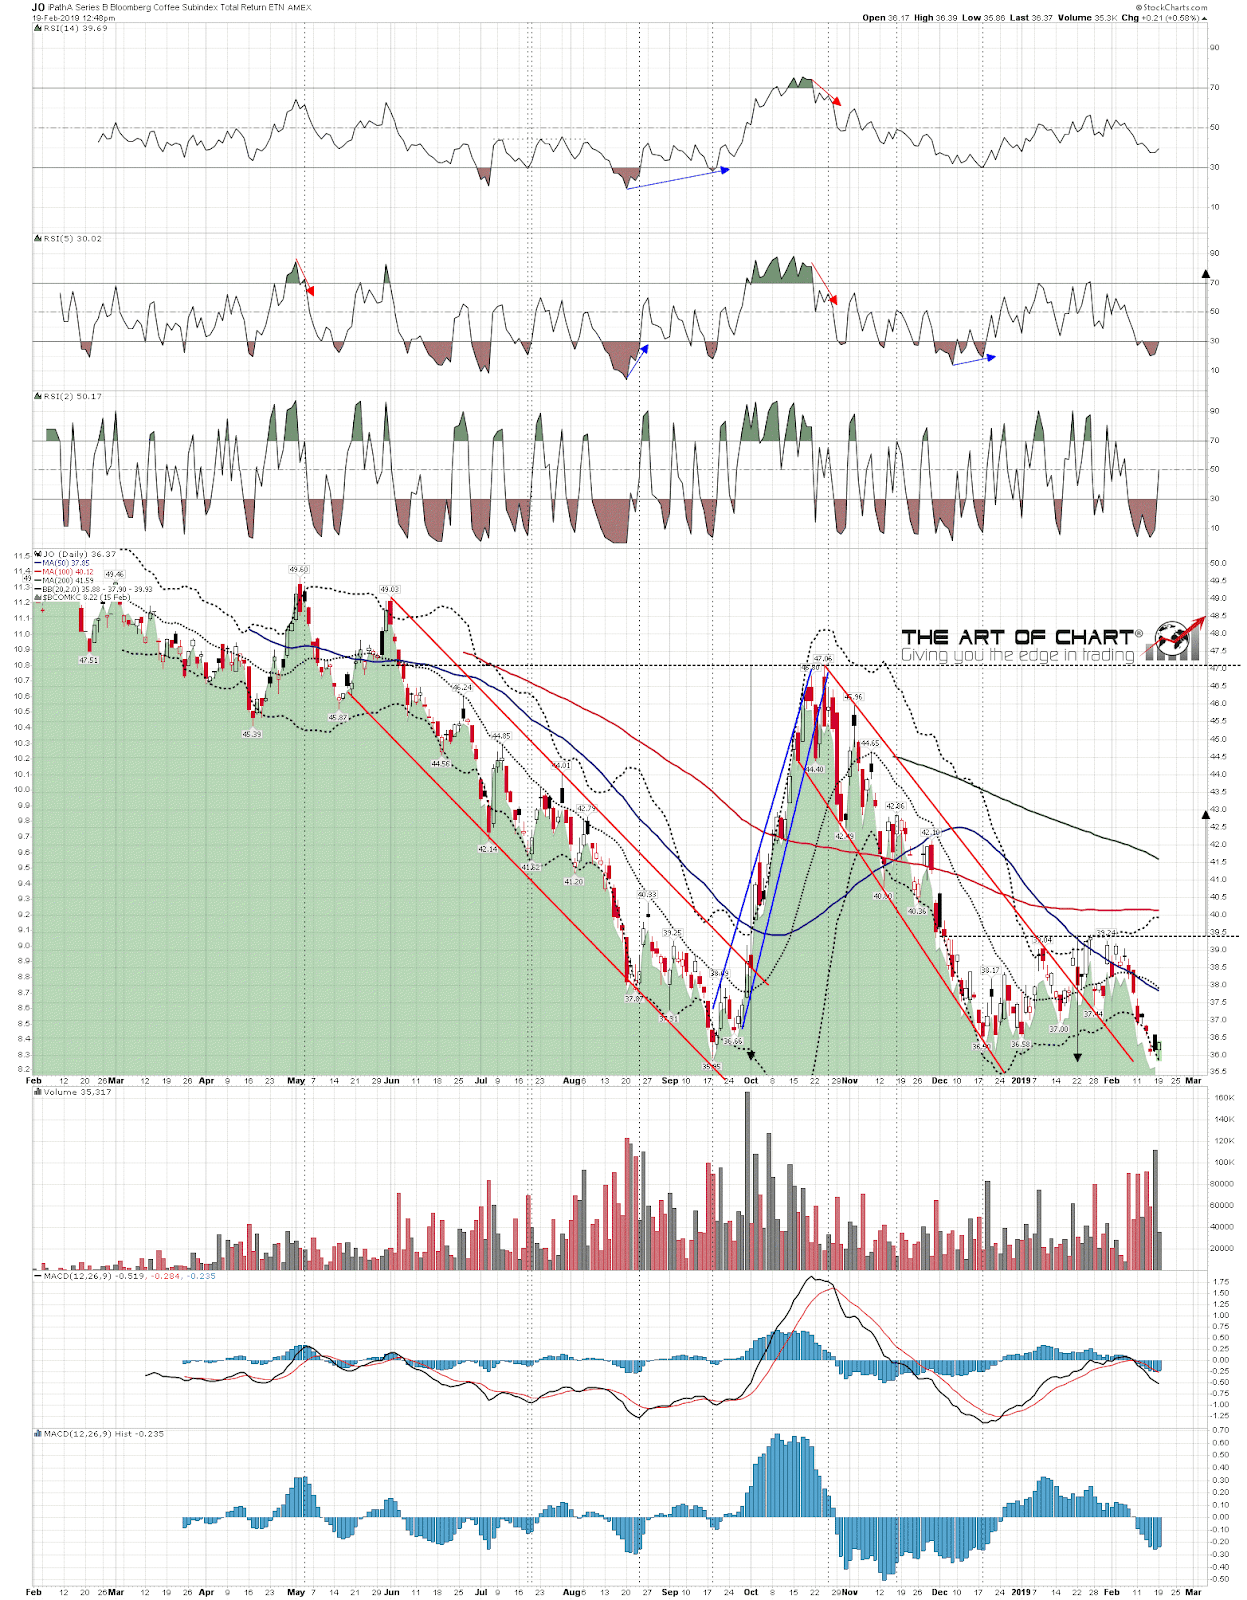
This very interesting coffee setup is far from alone in the commodities sector and we will be looking at this and others in the free public webinar on Thursday. If you’d like to attend you can register for that on our February Free Webinars page here.
 19th Feb 2019