I was looking at the likely reversal back up on Friday morning and obviously we have seen that. ES/SPX have since broken back strongly over the multiple resistance levels in the 2660-70 area, weekly and monthly pivots, daily middle band 5dma and 50 hour MA. So now what?
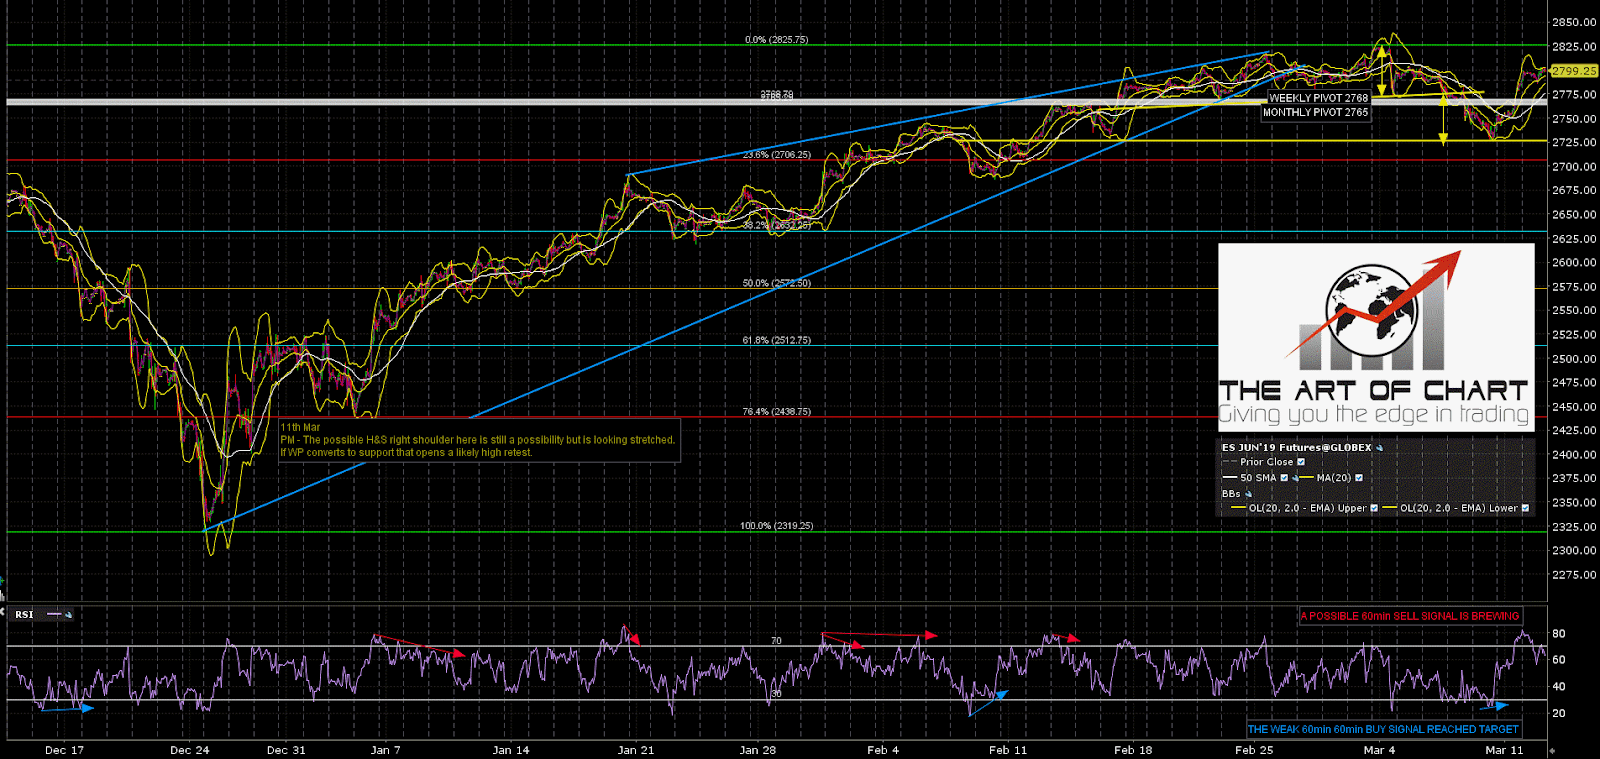
Well in the short term a retracement seems likely and in my premarket video this morning at theartofchart.net I was projecting an ideal path of a higher high (over 2799 ES Jun) setting up a possible 60min sell signal on ES. Ideally ES would then retrace back to the monthly pivot at 2765 ES (2760 SPX) before either breaking back down through that into lower lows, or (more likely) finding support and retesting the rally highs in what would probably be the second high of a double top setting up a larger retracement into the low 2600s.
Here’s how that short term divergence looks on the ES Jun 60min chart:
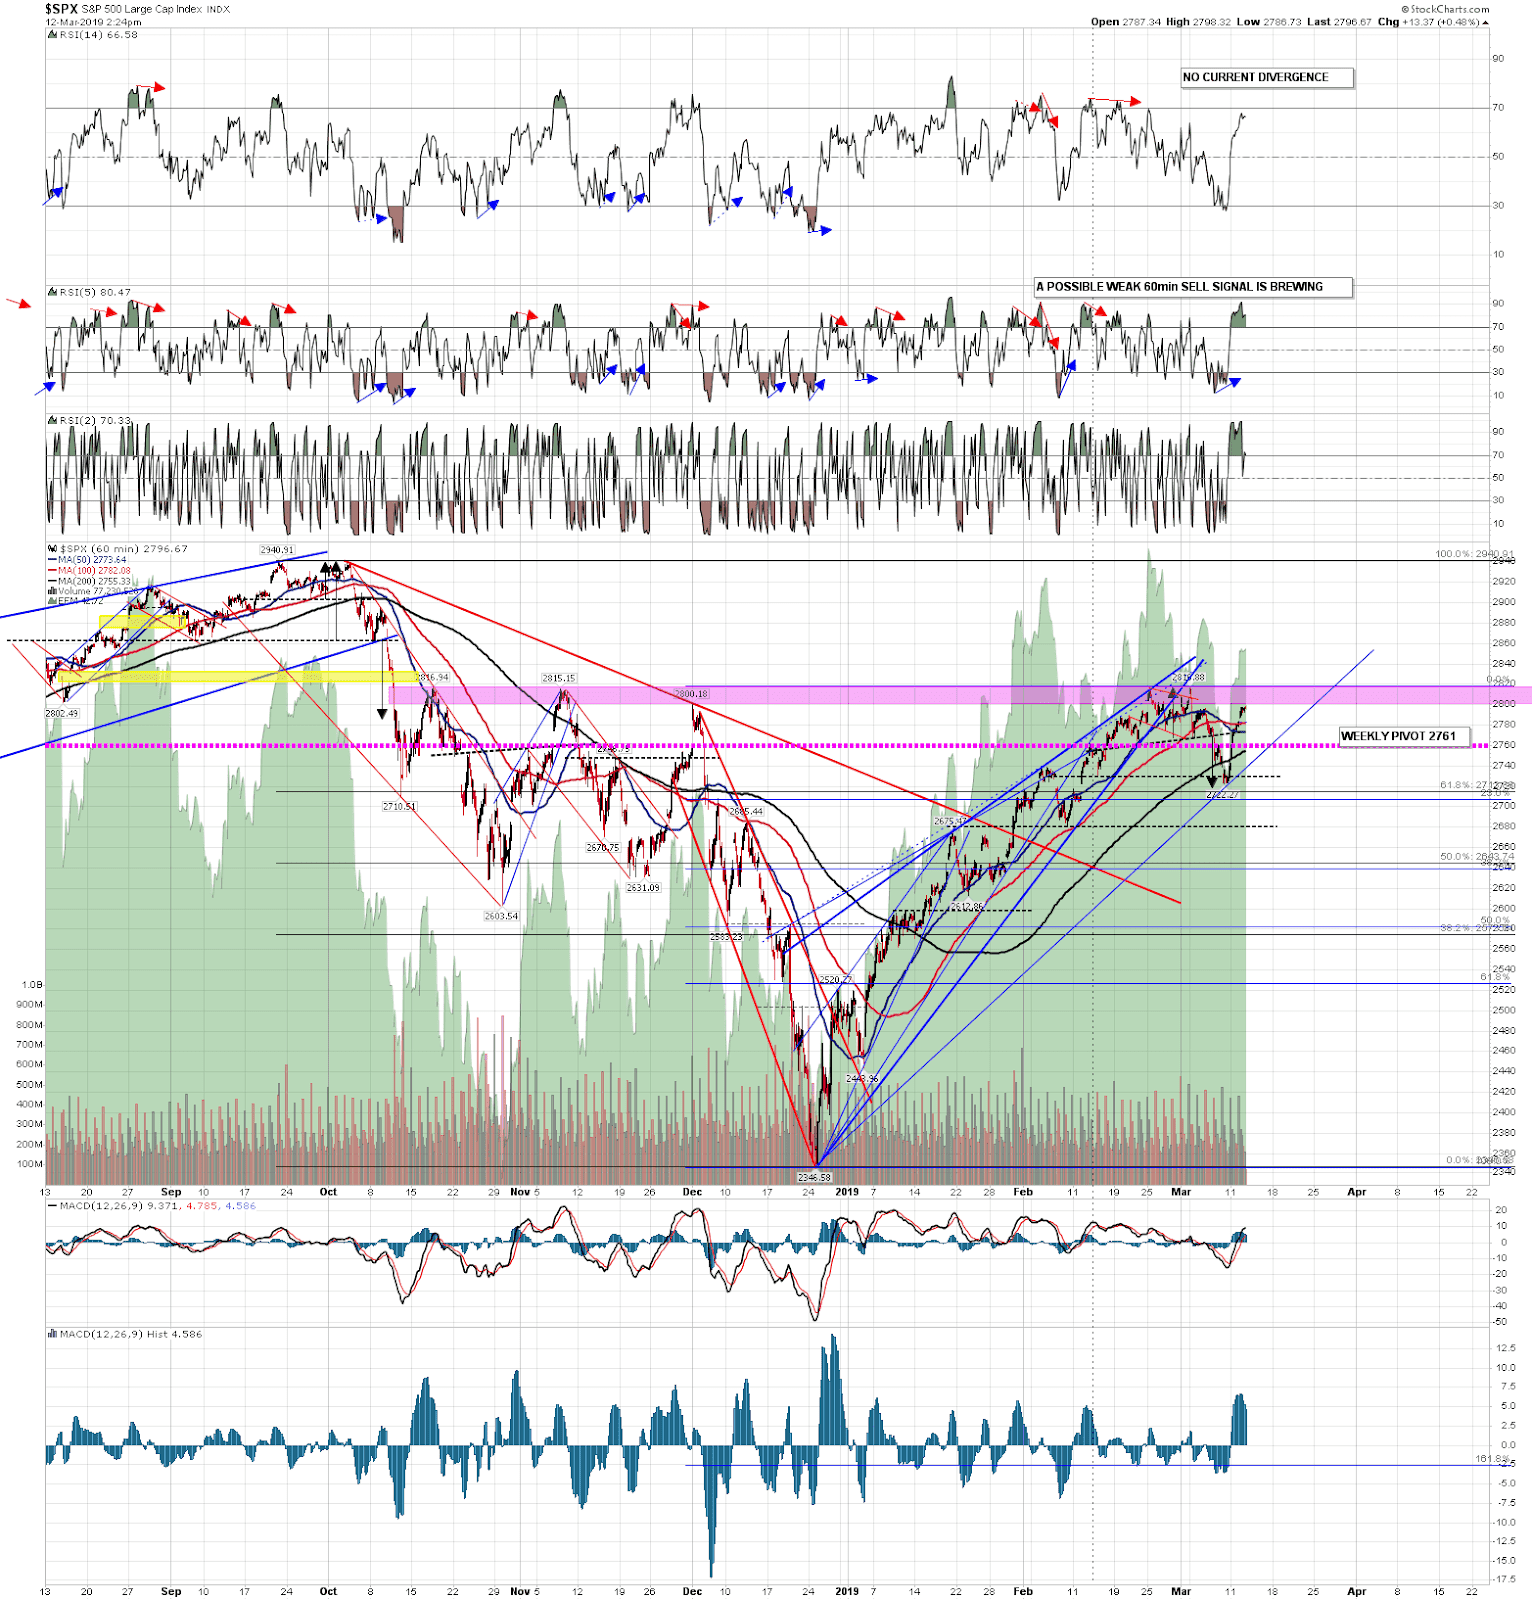
On the SPX hourly chart there is now a possible RSI 5 sell signal brewing.
SPX 60min chart:
That monthly pivot support on SPX / ES is a decent match with the SPX 5dma, now at 2768 and particularly important because the close back above the 5dma yesterday after the more than 2% decline has put SPX back on the Three Day Rule. On a close back below the 5dma today (extreme long shot) or tomorrow (potentially doable), I’d expect to see a retest of the low at 2722 before a retest of the rally high. We shall see.
SPX daily 5dma chart:

One other thing I mentioned in premarket video today was that in the event that NDX retested the rally high before the expected retracement here, that would set up a decent quality double top on NDX and increase the chance that a more significant lower high was being made on SPX here. NDX has retested the rally high now so that’s worth noting too. Nonetheless I still think that a retracement and then higher high here are more likely than a break down directly.
NDX 60min chart:

Either way, SPX is likely in the process of forming a high that should at least deliver a backtest of the low 2600s, and I’m expecting the downtrend for that move to get going within a few days.
 12th Mar 2019