On Tuesday I was talking about the likely outcomes if SPX/ES managed either to convert the weekly pivot (2879.50) to resistance or failed in that attempt, and the likely outcome in the event that WP held as support was a full retest of the swing high and likely marginal higher high. WP held as support then and, after a near miss yesterday, the full retest and higher high has been seen today. So where is this setup now?
Well as of the highs this morning all four of the rising wedges on SPX and ES from the December and March lows respectively have now slightly overthrown their wedge resistance trendlines. Hourly sell signals are fixed on SPX and RUT here, and daily sell signals are now brewing on all of SPX, NDX and RUT. This setup looks very ready to turn down here.
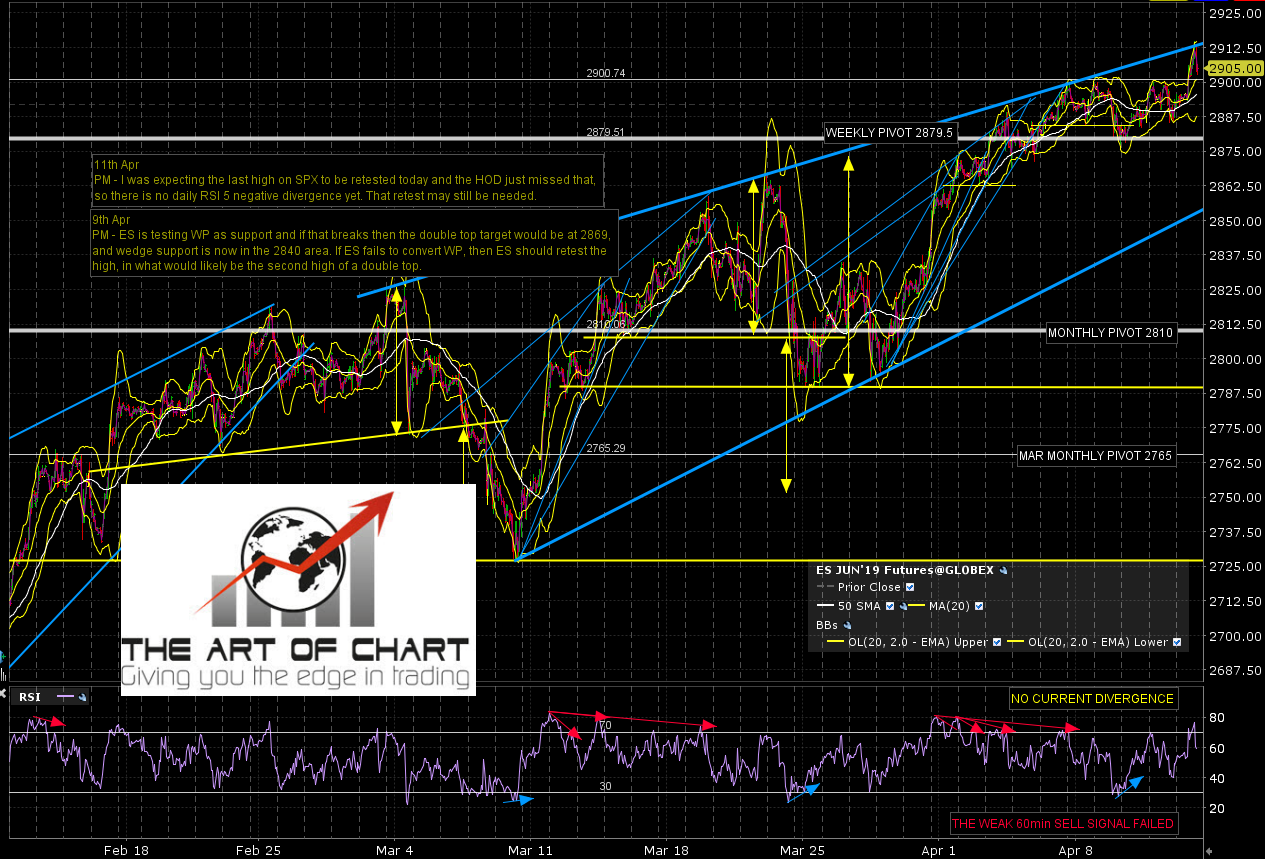
On the ES chart I’m wondering about a possible HOD retest to set up negative divergence on the ES hourly RSI. ES Jun 60min chart:
On the SPX hourly chart I’d note that the low this week was also at a test of short term trend support at the 50 hour MA. That is now in the 2885 area and a break and conversion of this level to resistance is the first step in any serious reversal on SPX. Watching for that SPX 60min chart:

Daily negative divergence on SPX was lost on the spike up into the last high. That is now back and I’m expecting this to fix soon and deliver a decent decline into May. SPX daily chart:

Does SPX have to turn here? Will it be forced to reverse course by the awesome power of my mighty trendlines? Well, that’s not really the way these things work, but the odds at this stage heavily favor reversal before we see a retest of the all time high now not far above, though my monthly middle band stat that I called at the end of January does have me expecting an all time high retest this year, very possibly in the summer after a low in May.
Everyone have a great weekend! I know I will 🙂
 12th Apr 2019