At the end of every year Stan and I do a public webinar where we look at the more likely options for price moves on indices, bonds, forex, metals, energies and other commodities over the coming year. At the one we recorded on 30th December 2018 we were asked a question as to what could invalidate the scenario that SPX was in an ongoing bear market and I gave the reply below talking about the important resistance at the monthly middle band in an ongoing market.
Excerpt from 2019 Outlook public webinar recorded 30th December 2018 looking at the SPX monthly middle band in bear markets. :
I followed that up with a post the next day on New Year’s Eve (no, I don’t get out much) talking more about that, with the observation that if SPX closed a month significantly back above the monthly middle band on the rally from the low, then the odds would strongly favor a retest of the all time high before any significant lower lows. You can see that post here. I then followed this through into the close back above the monthly middle band at the end of January and since in other posts.
SPX monthly chart:
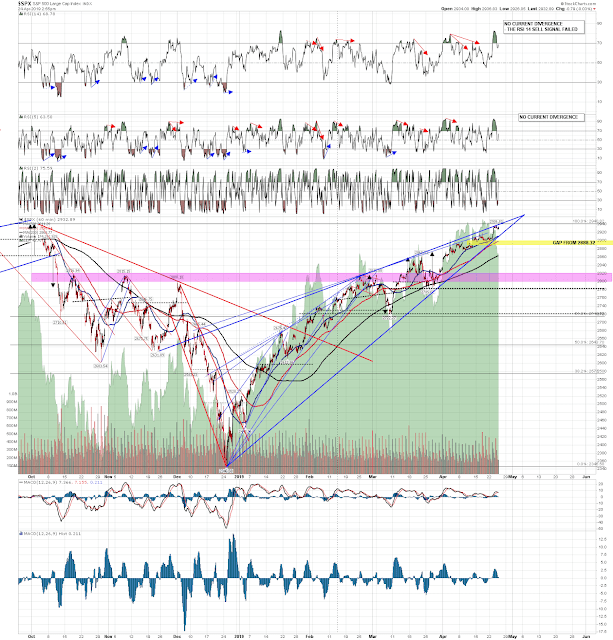
I was expecting this current swing high to be a lower high under the SPX all time high on the basis of the pattern setup and daily RSI divergences across multiple indices and while yesterday’s trend up day hasn’t much changed the pattern setup, it did fail the fixed daily and hourly sell signals and apart from the daily RSI 5 sell signal on ES that just survived the RSI spikes, there is now no negative divergence on the daily or hourly charts on SPX, NDX or RUT or associated futures. The odds favor needing some or all of that to be re-established, and to do that SPX will need a retracement and then a higher high, which at this stage would almost certainly require a retest of the all time high on SPX at 2940.91.
SPX daily chart:
There have been a slight modifications to the support and resistance trendlines on the rising wedge on SPX with the latest move up but while wedge support is now once again unbroken, wedge resistance is again being slightly overthrown. I’d note that wedge support and resistance are due to intersect before the end of April, so a high within this wedge should be very close indeed, and I’m expecting the SPX all time high retest this week. SPX 60min chart:
Stan and I are doing a webinar an hour after a close tonight that is the next in our series on trading commodities. We’ll be looking tonight at possible trades on copper, oil and coffee. If you’d like to attend you can register for that here, or on our April Free Webinars page.


 24th Apr 2019
Can’t wait for an update. At SPX 2943 now, all time highs. For the breakdown from wedge, is it just 1 percent and they buy the dip? Or can we expect something more? Perhaps a cup and handle forming to take us higher again? Market seems teflon coated!