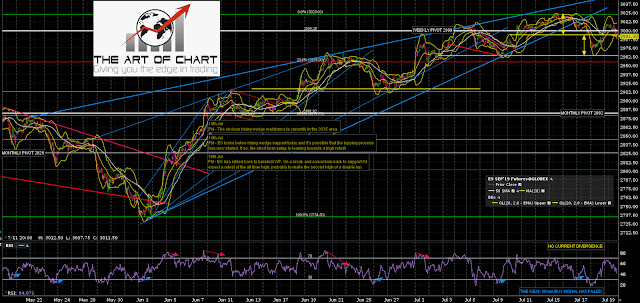
The daily RSI 5 / NYMO sell signal that was brewing last week has fixed on this first decline from the all time high and has not yet reached target. The rising wedge has broken down into a test of the daily middle band so far, and I am looking for a reversal pattern to form. The obvious options are either to retest the all time high to make the second high of a small double top or to head further down towards the 2964 area and the possible H&S neckline there.
SPX daily chart:
I was talking on our free public ‘favorite setups’ webinar last night about the importance of the 50 hour MA on SPX, and that was resistance on SPX at the high yesterday, and while that was broken slightly at the highs today, that was not converted back to support and has rejected late in the day. The obvious next target for me is another test of the daily middle band, now at 2973, and a likely break down towards the mid 2960 area and the possible H&S neckline support there.
SPX 60min chart:
ES broke back over the weekly pivot today but failed to convert that to support either.
ES Sep 60min:
Stan and I did a free public webinar yesterday looking at some of our favorite setups. If you missed that you can see the recording on our July Free Webinars Page. We looked at examples of charts from this week and if you watch the video you can see how the setups we looked at delivered nicely today.
Neither Stan or I spends much time talking about setups we look at in these webinars in retrospect, as we both feel that it seems like boasting, and there is already plenty of that on twitter without us pitching in. It also smacks of vanity, which can be a fatal flaw in any analyst. That said, our marketing people point out that referring back to past successes might be be better described as marketing rather than bragging, so that being the case I’ll talk quickly about the two setups that I was talking about last night in the webinar, and that you can see on that recording.
The first setup was buying or selling the 50 hour MA in a counter-trend backtest during a trend, and obviously you can see the reaction to the fail at the SPX 50 hour MA today. The other setup I looked at was the double bottom on CL yesterday afternoon. I was looking at that on positive RSI divergence, and noting that the double bottom target in the 56.50 area was both a strong match with a 61.8% retracement of the last leg down, and with a test of the monthly pivot at 56.46. I was saying that CL was a decent looking long into that target and an interesting short when it got there. The overnight high was at 56.49 and the subsequent low today was 55.12 so both were nice calls. We do a lot of nice calls and don’t usually mention them, but my point is that the free public webinars are always worth watching IMO.
Everyone have a great weekend 🙂


 19th Jul 2019