SPX gapped up over 3000 this week and has been sustaining trade above it, with retracements. My working assumption is that SPX is on a path to reach my 3100 target area. So how is that looking on the SPX hourly chart?
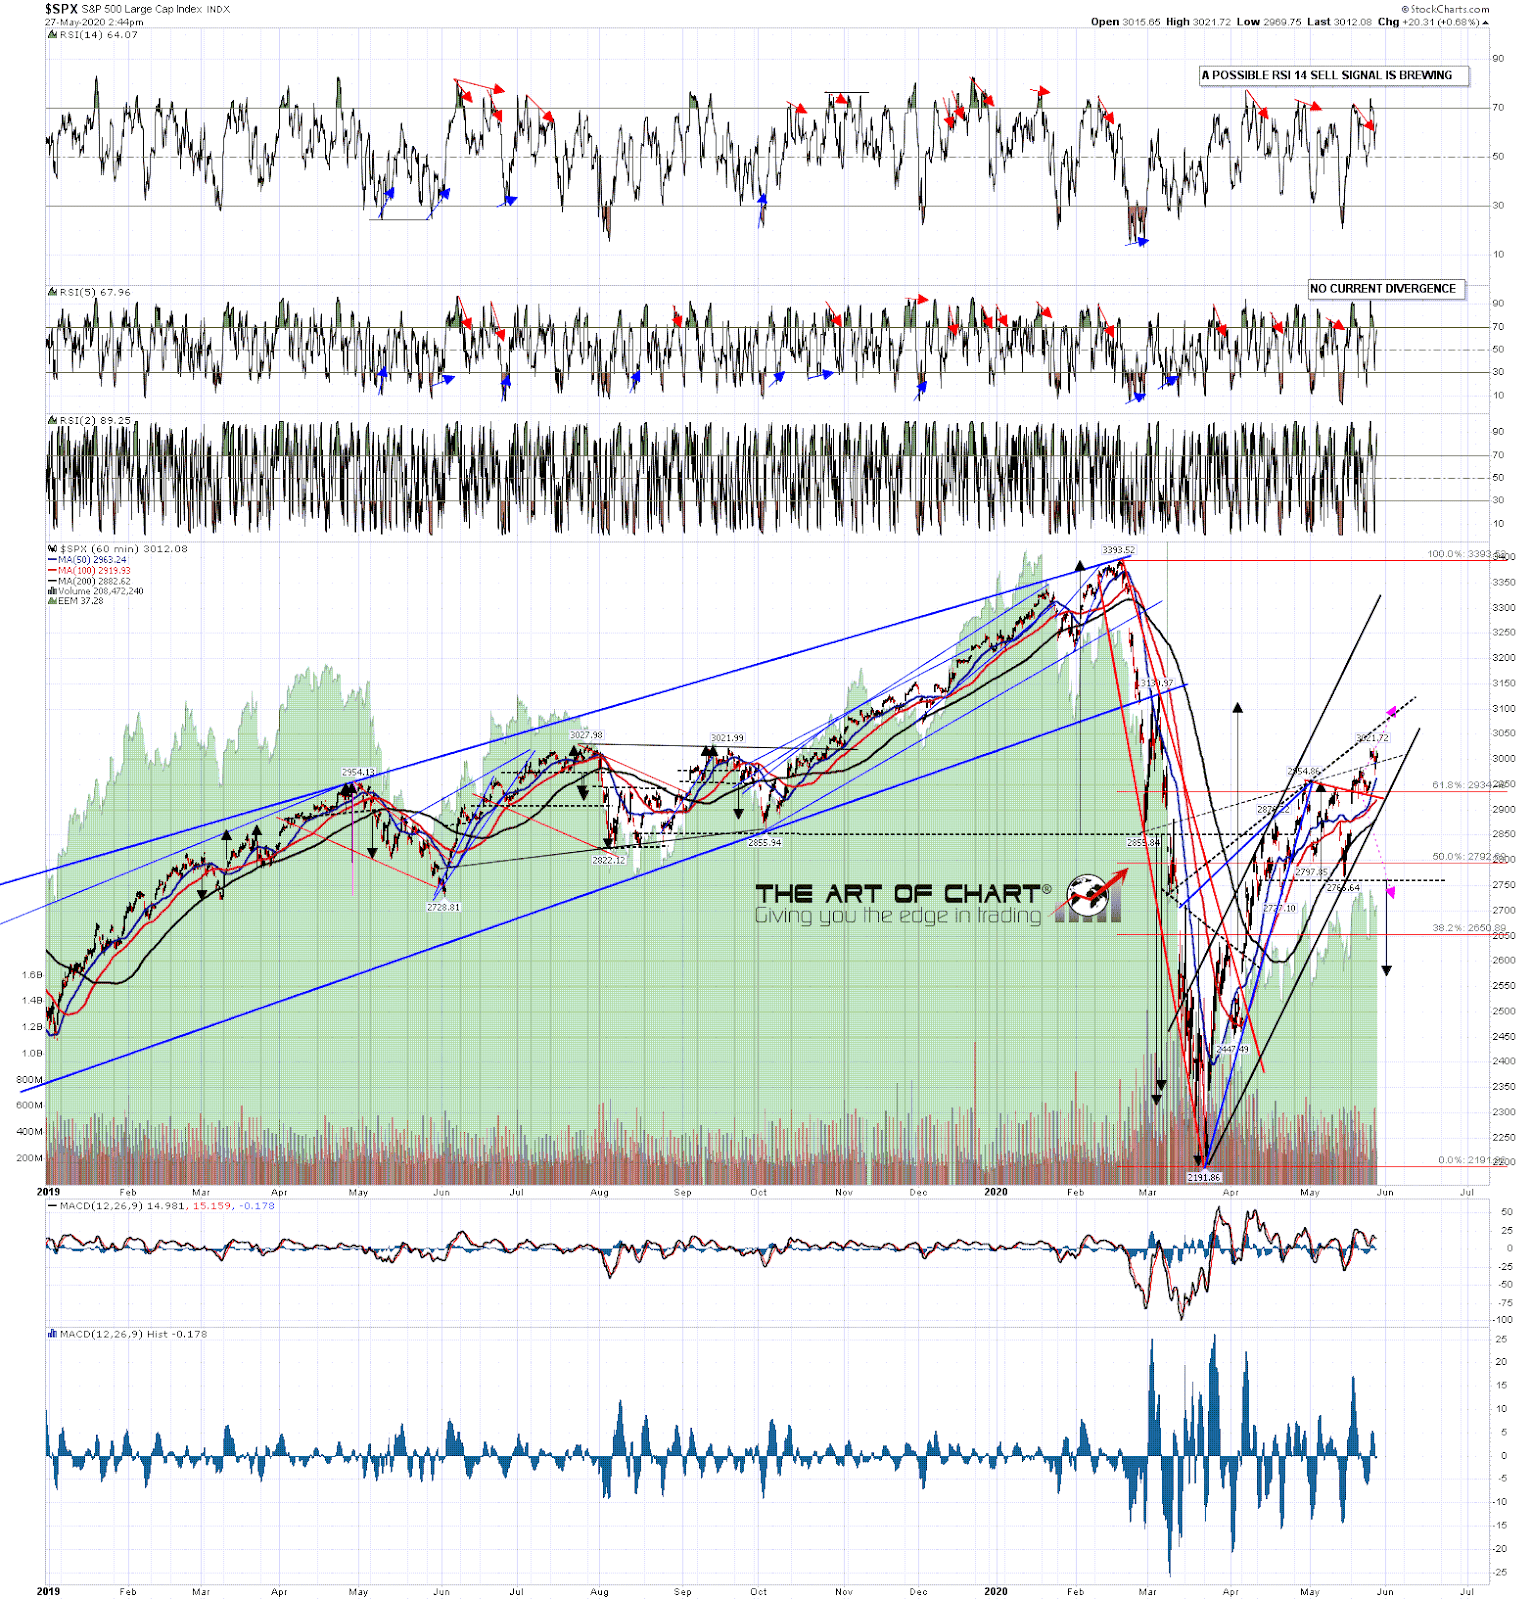
Well I drew in two high quality possible rising wedge resistance trendlines on my SPX chart a couple of weeks ago and the first was resistance last week and then was gapped over at the weekend. I’m looking at the next one higher and if that was to be hit in the 3100 area, that would likely be towards the end of next week. There is already a possible hourly RSI 14 sell signal brewing but I’d expect SPX to need to go at least a bit higher to deliver a decently formed divergence. Main rising channel support is now in the 2900 area.
SPX 60min chart:
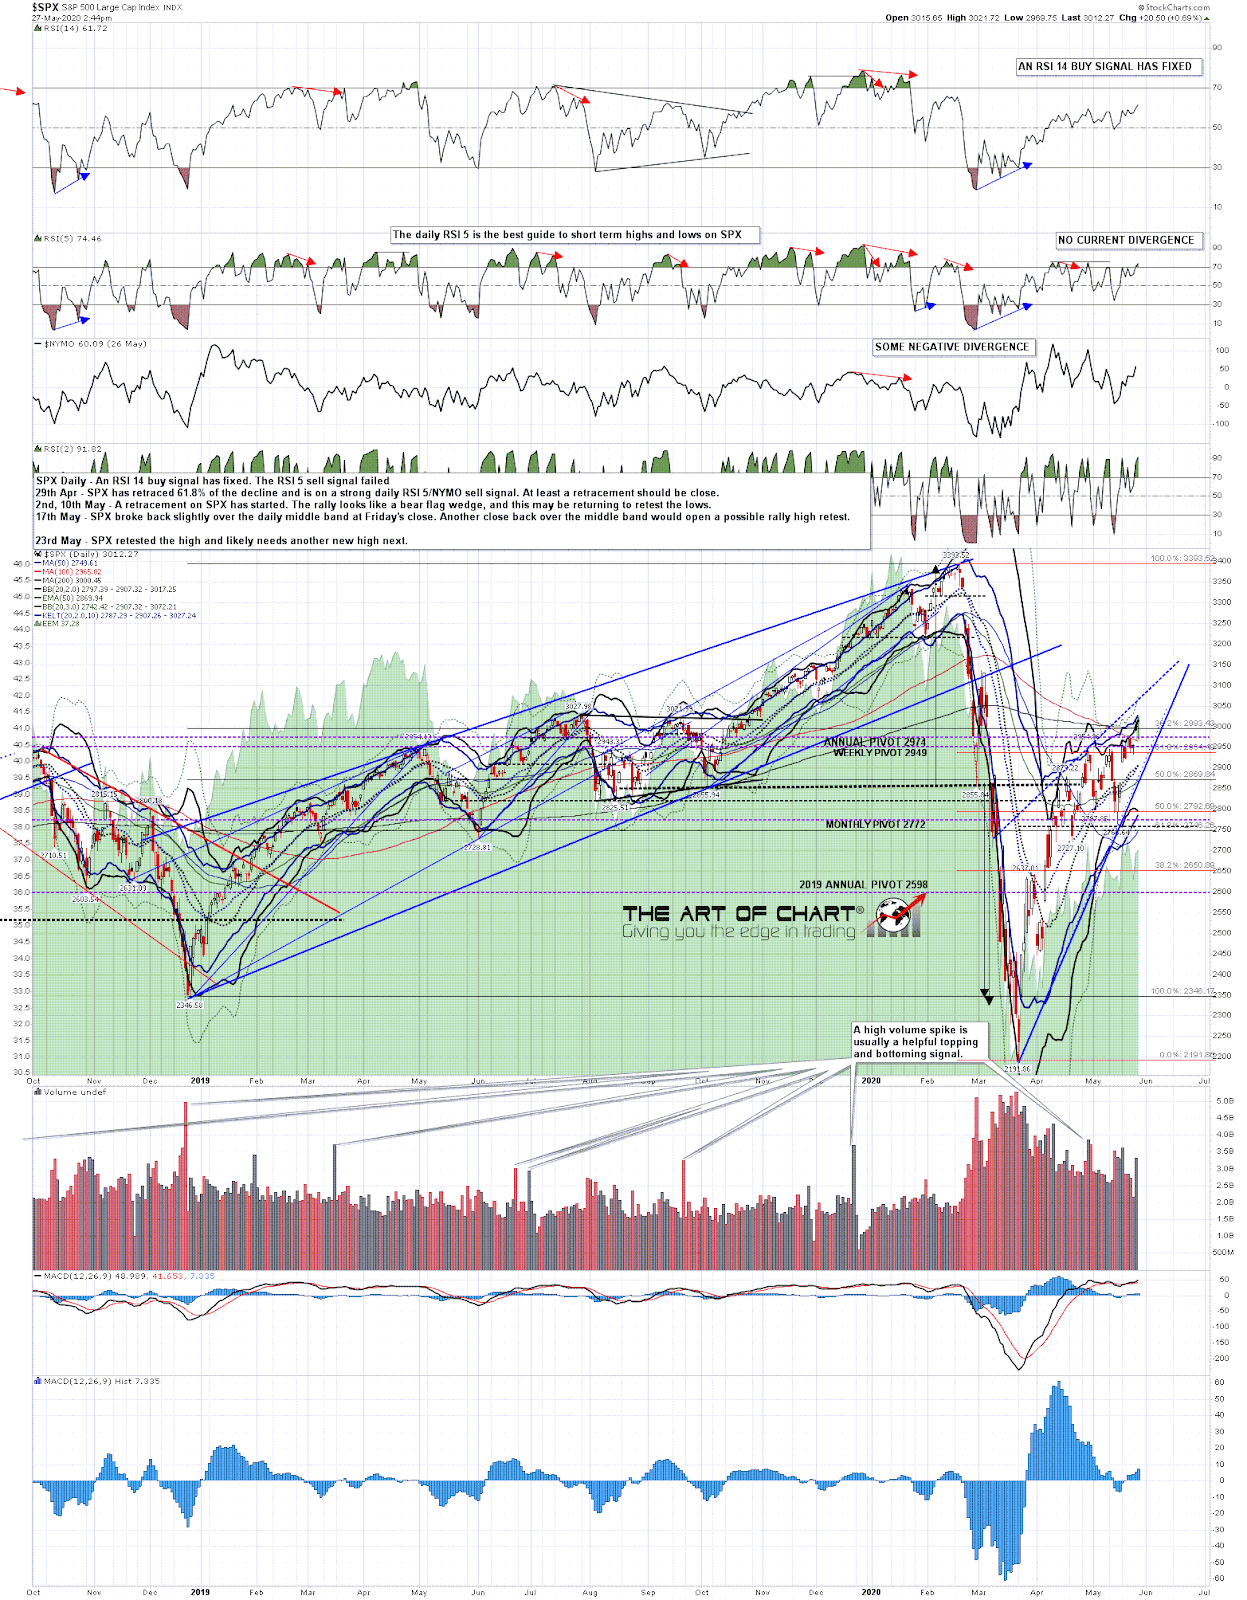
On the daily chart main support is at the daily middle band, also now in the 2900 area. I’ve drawn in the possible wedge resistance area that I’m looking at and ideally I’d be looking for daily RSI 5 and NYMO negative divergence to have formed by the time that 3100 target area is hit.
SPX daily chart:
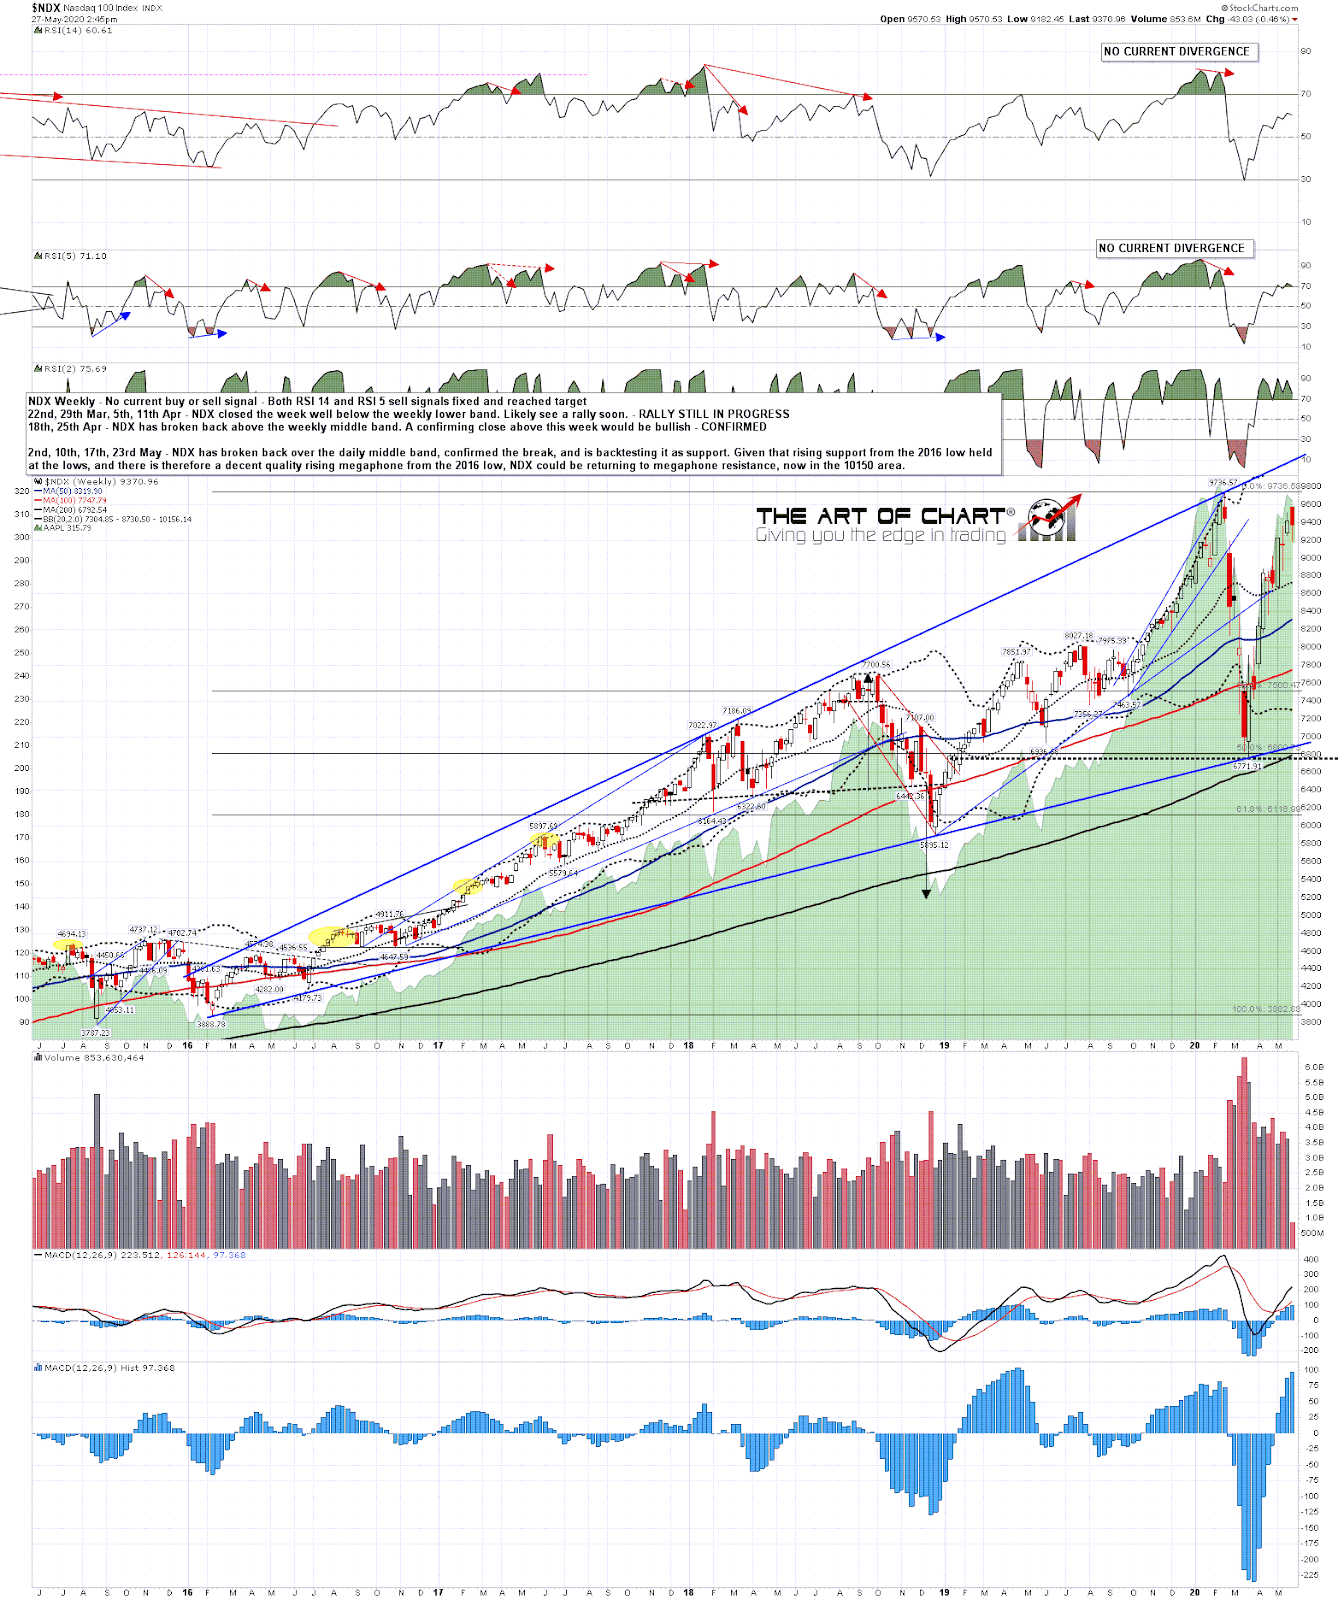
As well as IHS target on SPX in the 3110 area of course I am also watching the rising megaphone on NDX, which has been lagging so far this week. The main target that I am watching for here is on NDX at the test of rising megaphone resistance, that would require getting through resistance at the retest of the all time high before continuing up towards that higher target in the 10,150 – 10,200 area. NDX will likely need to pick up the pace a bit to get there.
NDX weekly chart:
In summary I am looking for both of these targets, 3110 area on SPX and 10,2000 area on NDX, ideally to be hit together near the end of next week or the start of the week after. We’ll see how that goes.
Stan and I are doing a webinar an hour after the close on Thursday at theartofchart.net on FAANG stocks and key sectors. If you’d like to attend then you can register for that on our May Free Webinars page.
 27th May 2020