Just a reminder before I get started that we are running our July 4th sale at theartofchart.net at the moment and that will be running until the end of next week. For the duration of the sale annual memberships are available for the price of only eight months at the monthly rate rather than the usual ten and as ever with all our memberships, the membership rate will remain the same with no price rises for as long as the subscription is maintained. If you are interested then you can find the sale page here.
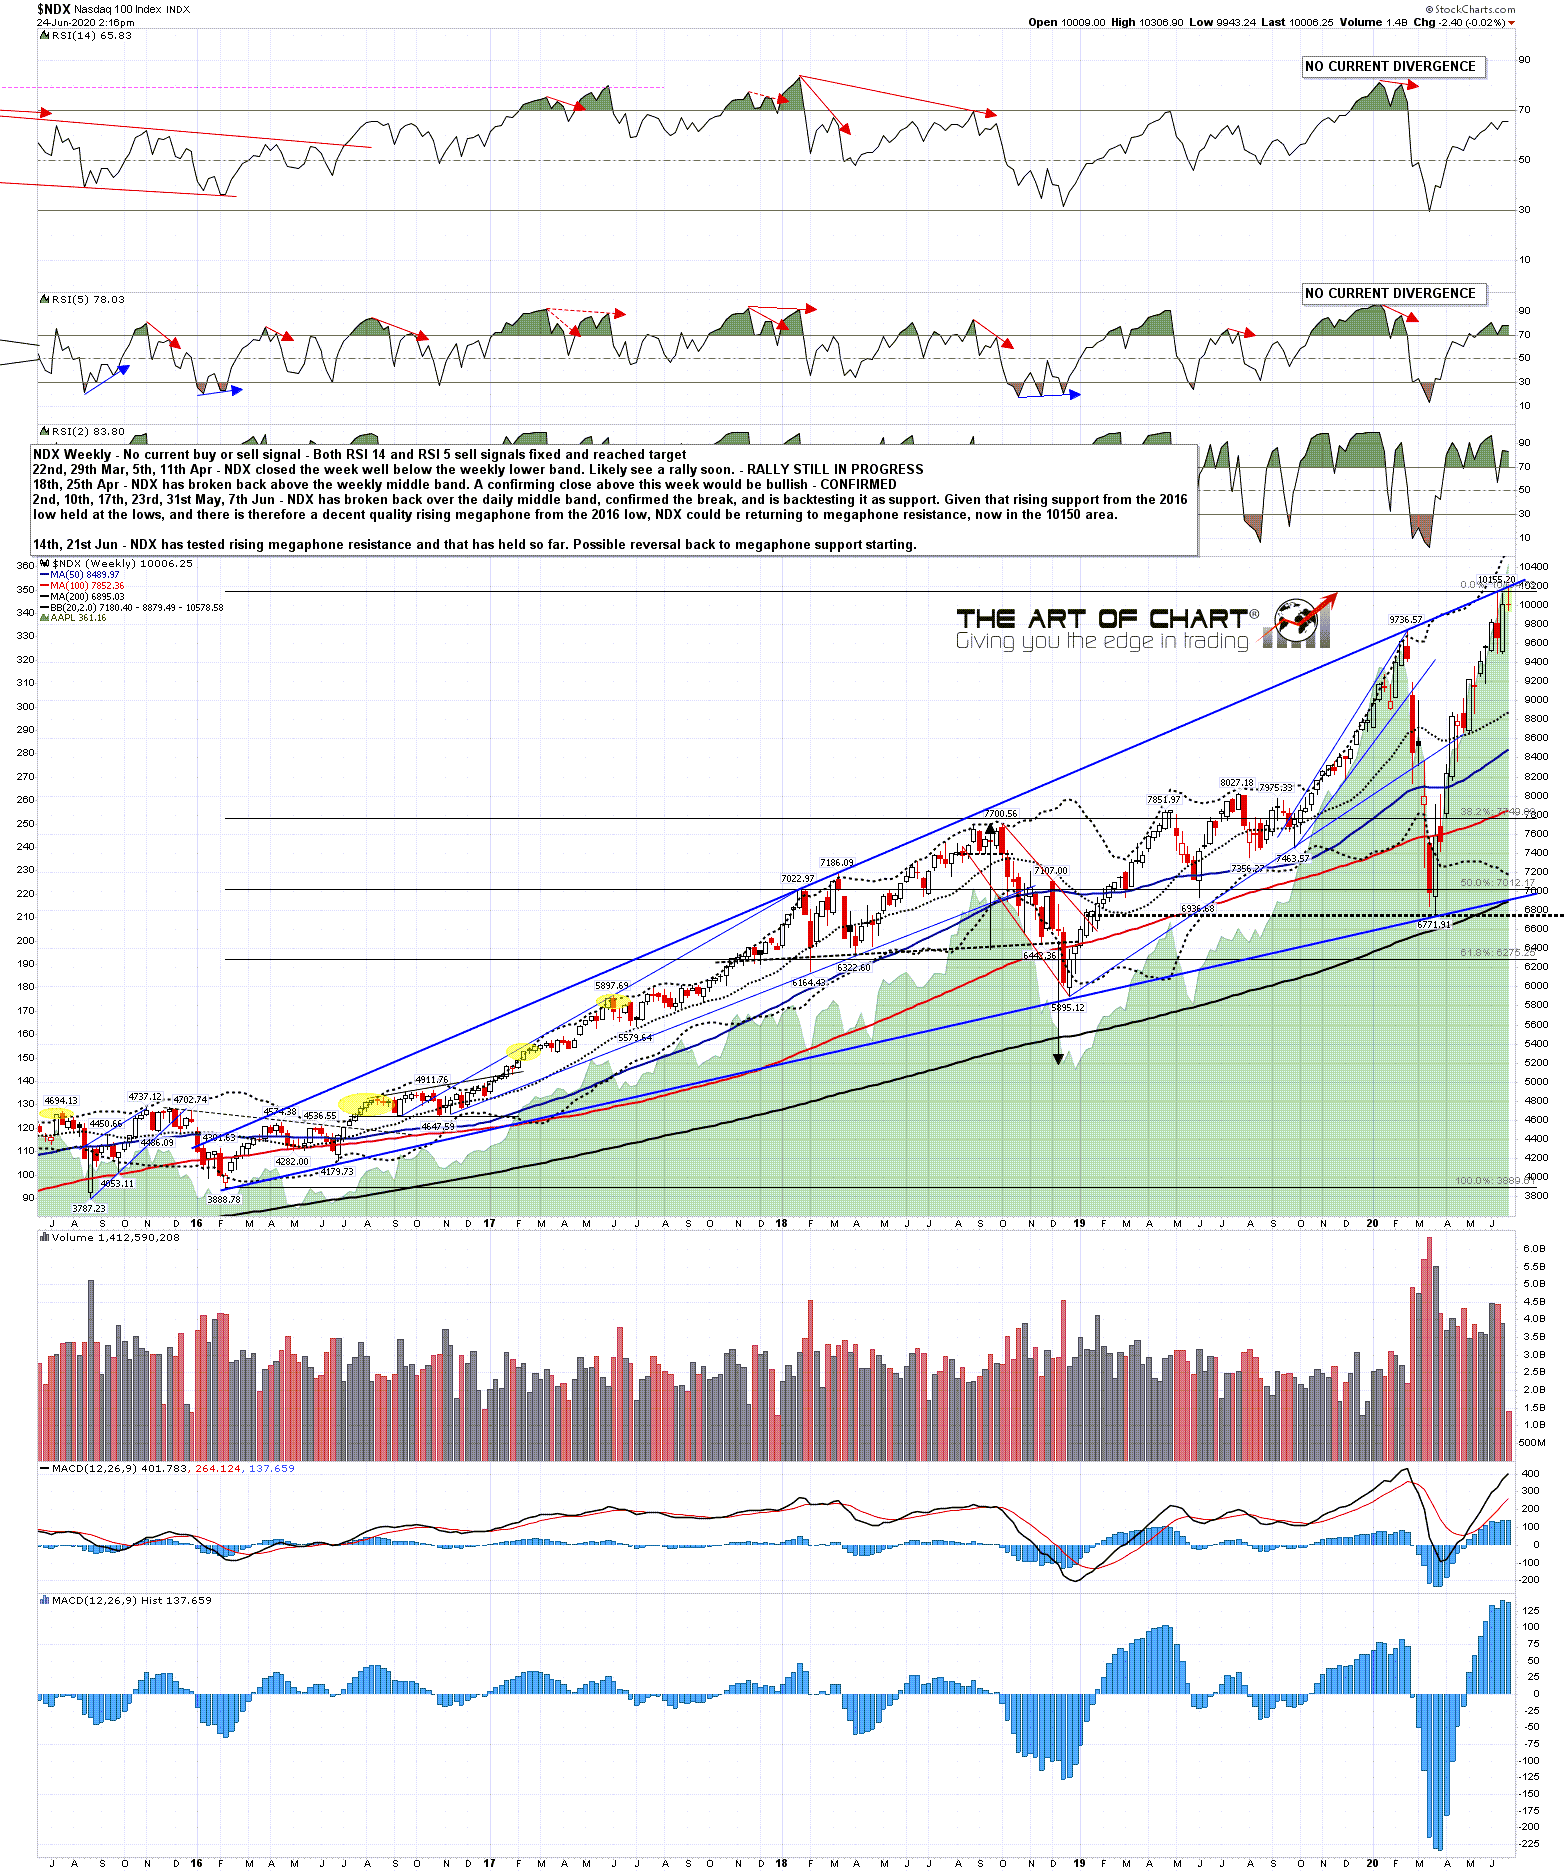
On to the markets. I was writing last week about the Janus (Bull) Flag targets at retests of the June highs on SPX, NDX, RTY and INDU and I was noting that NDX would likely reach that target first (done) and would then likely retest a major resistance trendline just above there afterwards (retested) and that the upswing on equities might fail there (possibly happening). Here is that updated NDX weekly chart.
NDX weekly chart:
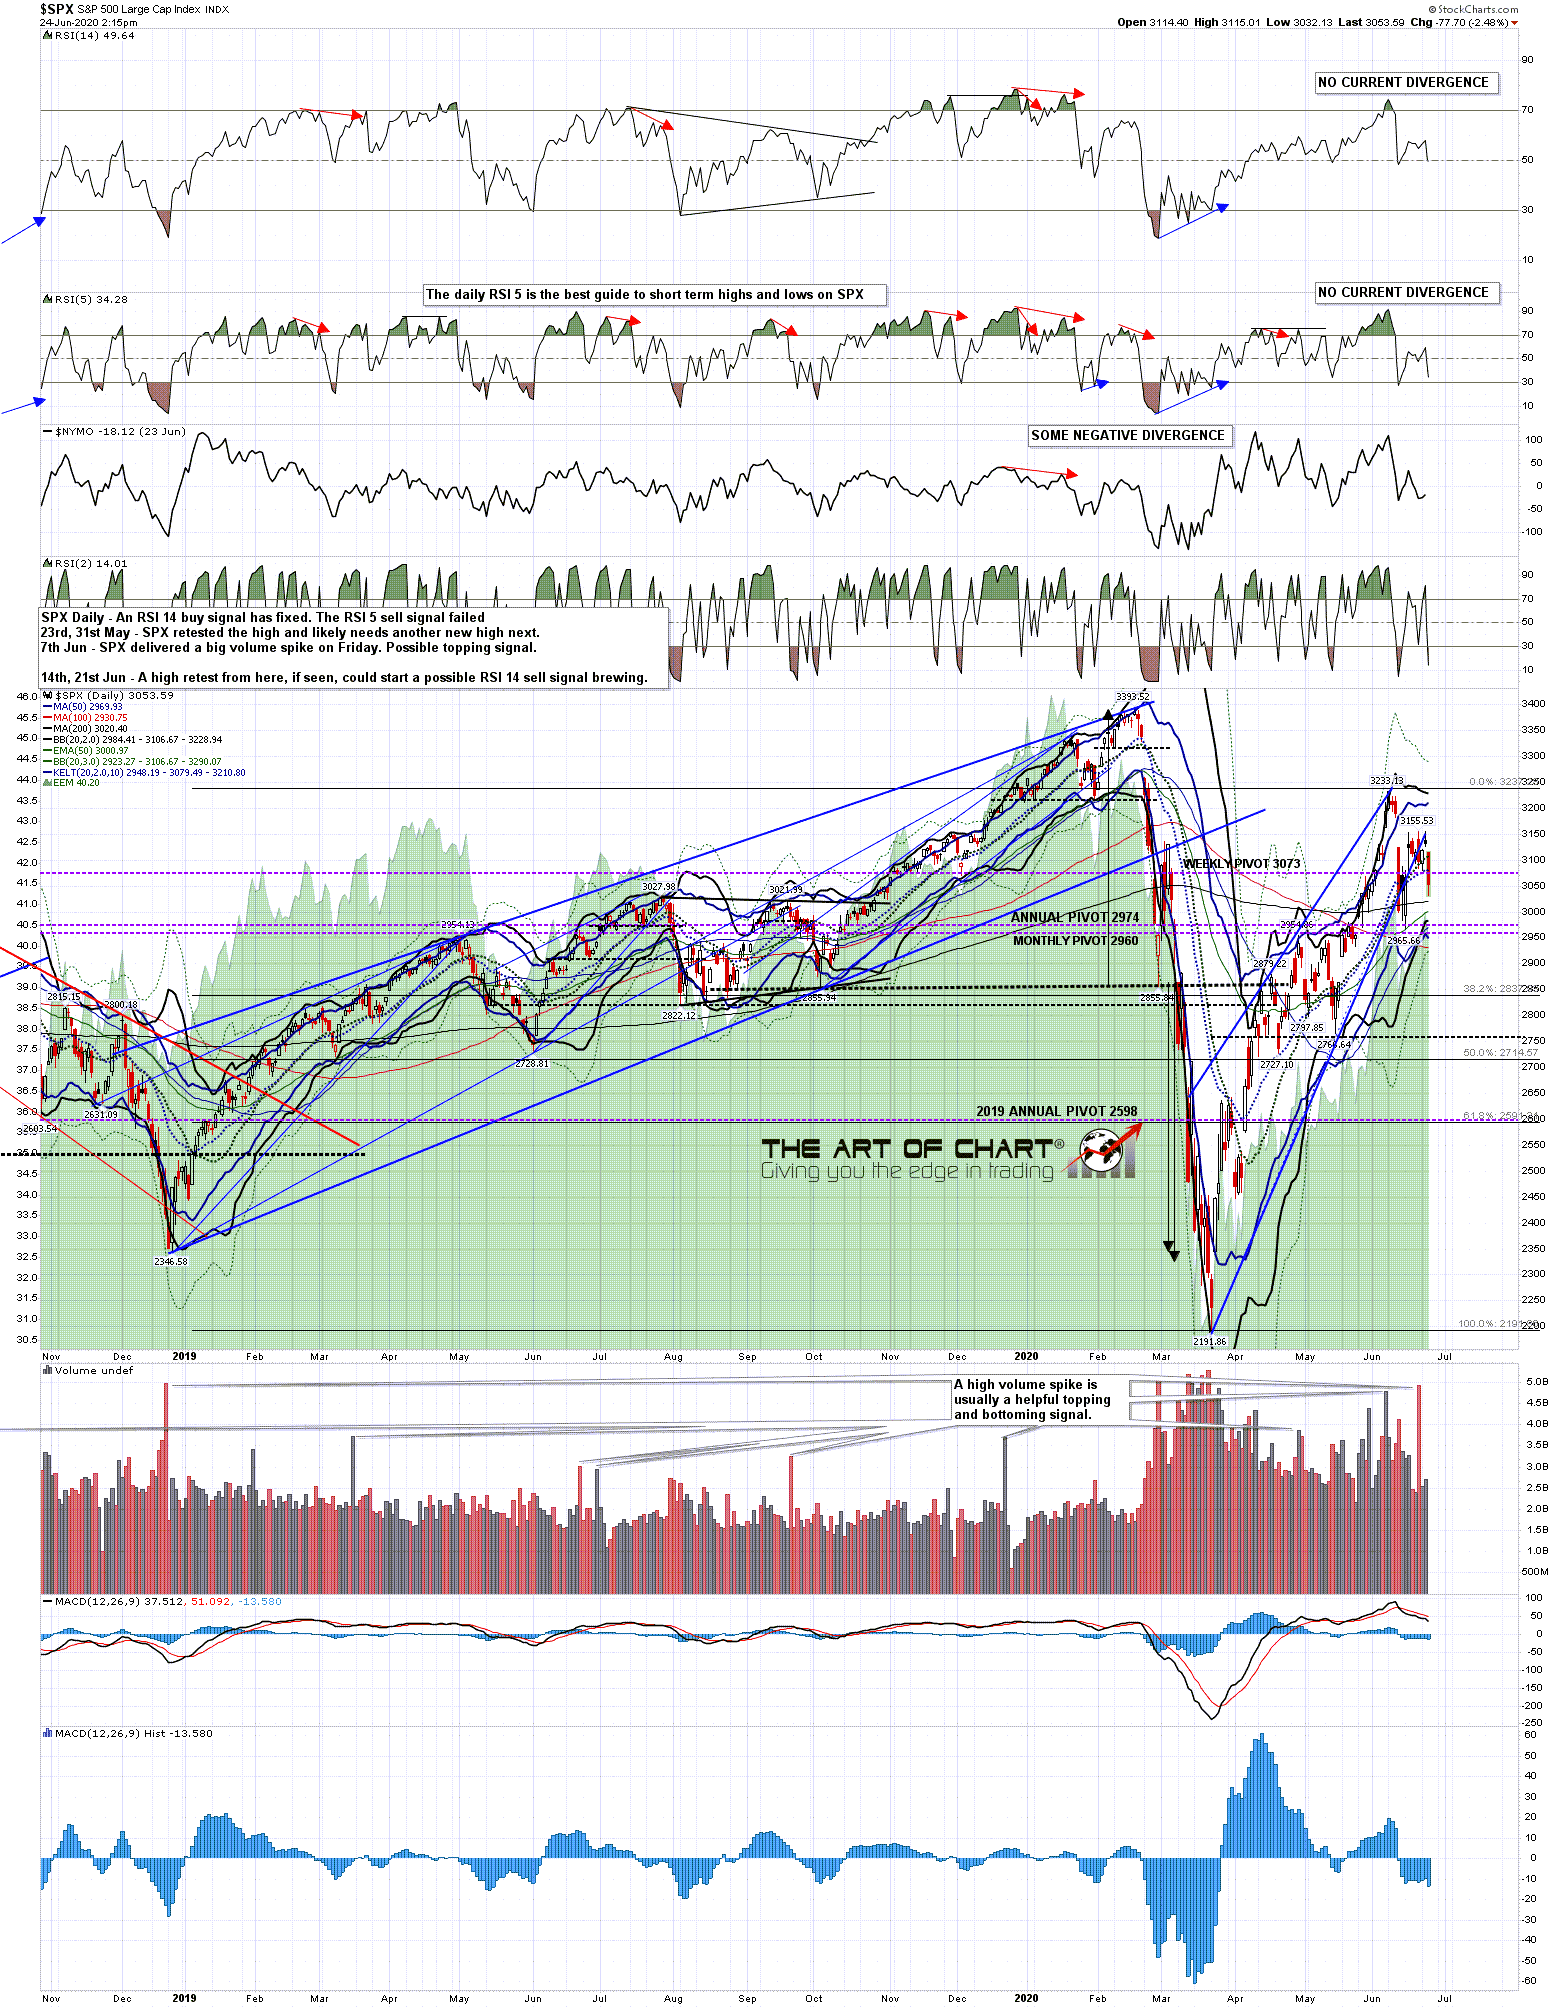
I’ve been watching two key support levels on SPX and those are the SPX daily middle band, now at 3106, and the hourly 50 MA, now at 3112. Obviously those both broke this morning and for a confirmed break back below the daily middle band, that needs a daily close below the middle band today and a confirming close below tomorrow. If that is seen then this high on equity indices may be in and they may be starting a sizeable move down. There is another big support area below the daily middle band on SPX worth watching and that is the 200dma, currently in the 3020 area.
SPX daily chart:
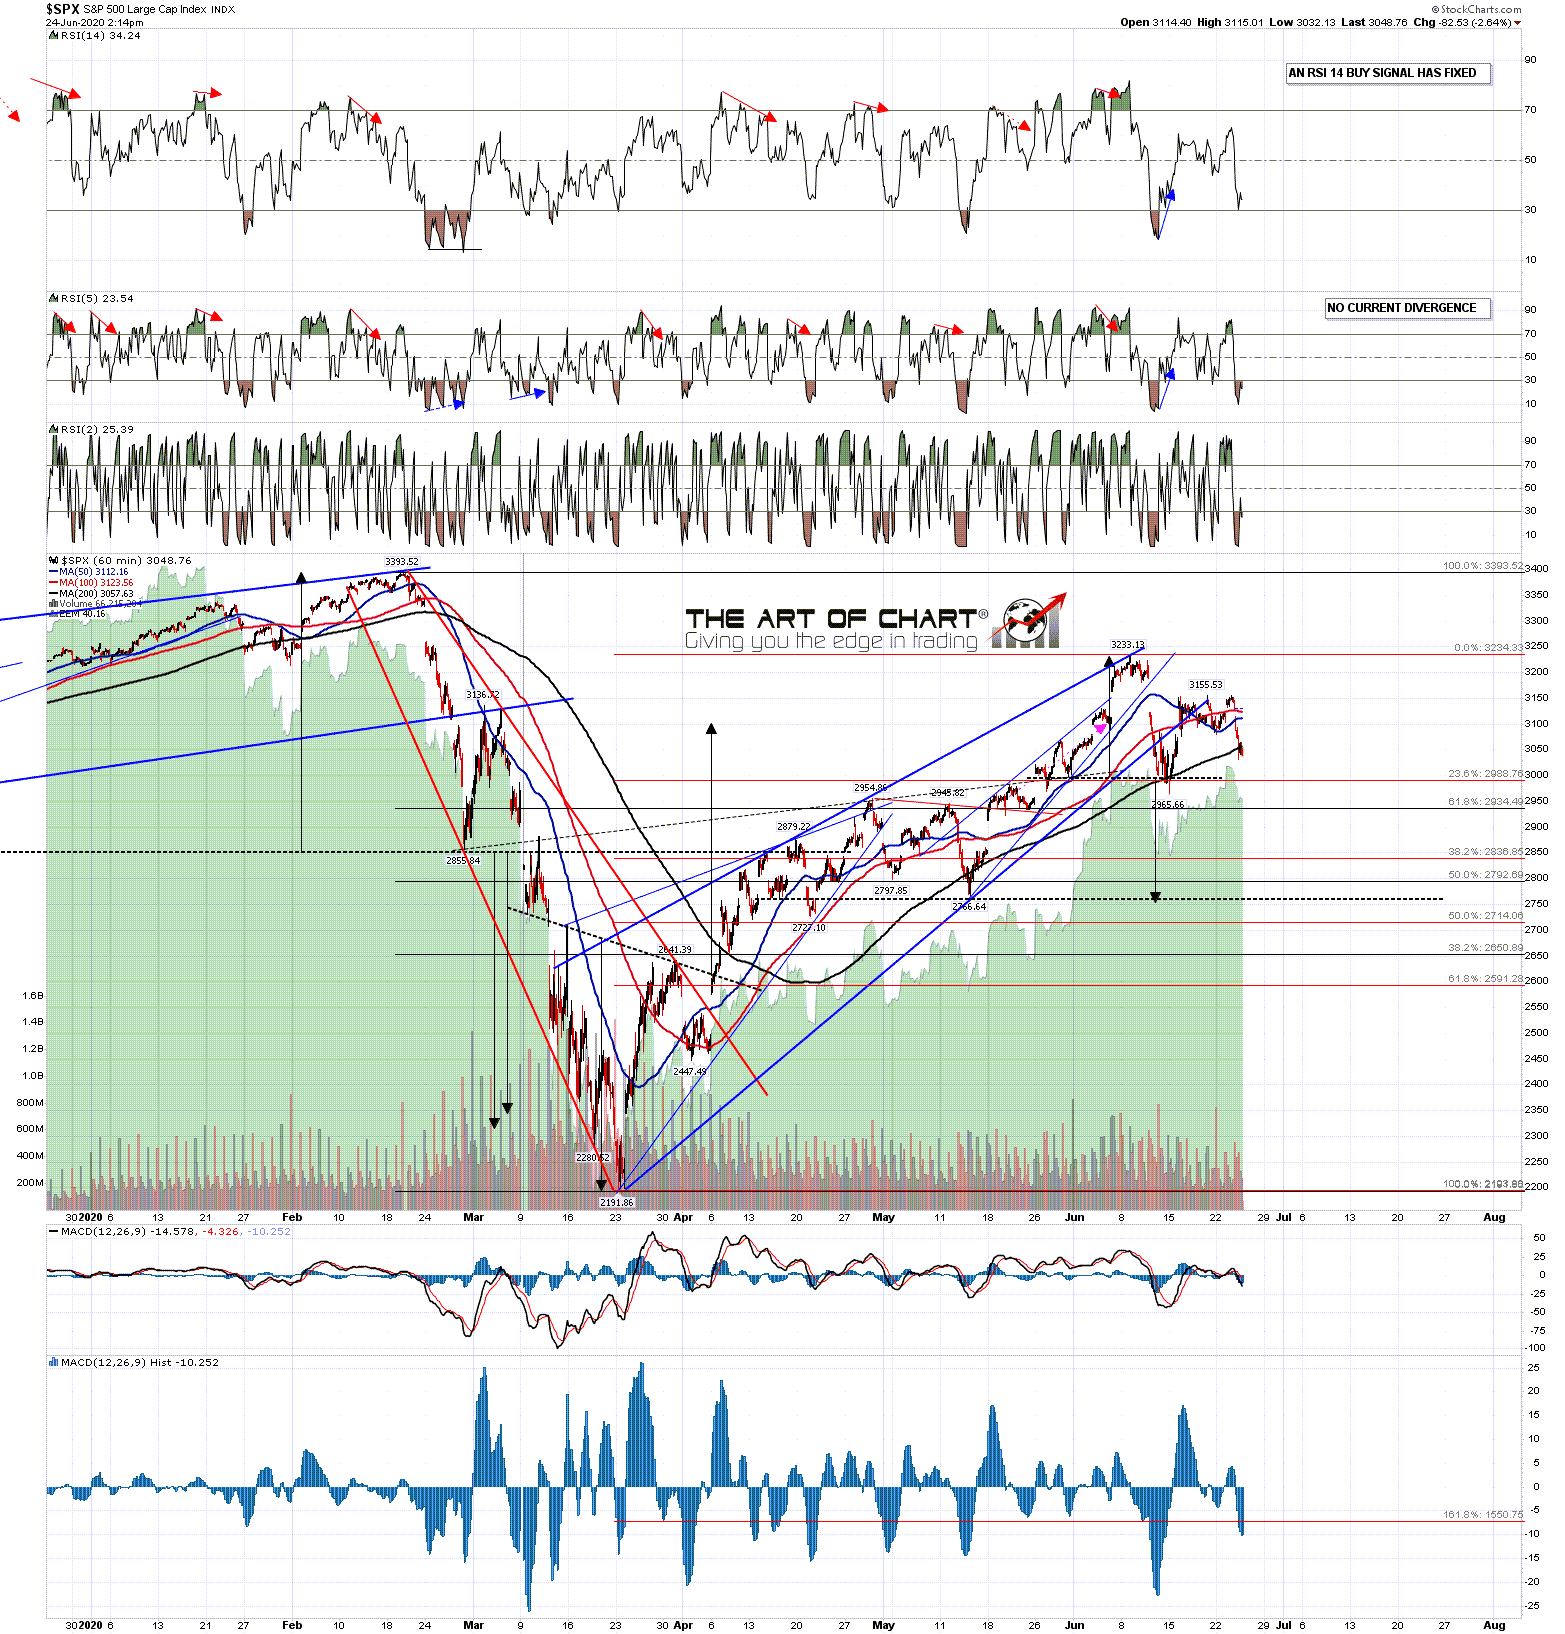
On the hourly chart there is no negative divergence and no obvious topping pattern which isn’t ideal. Some secondary support at the hourly 200 MA tested at the lows so far today.
SPX 60min chart:
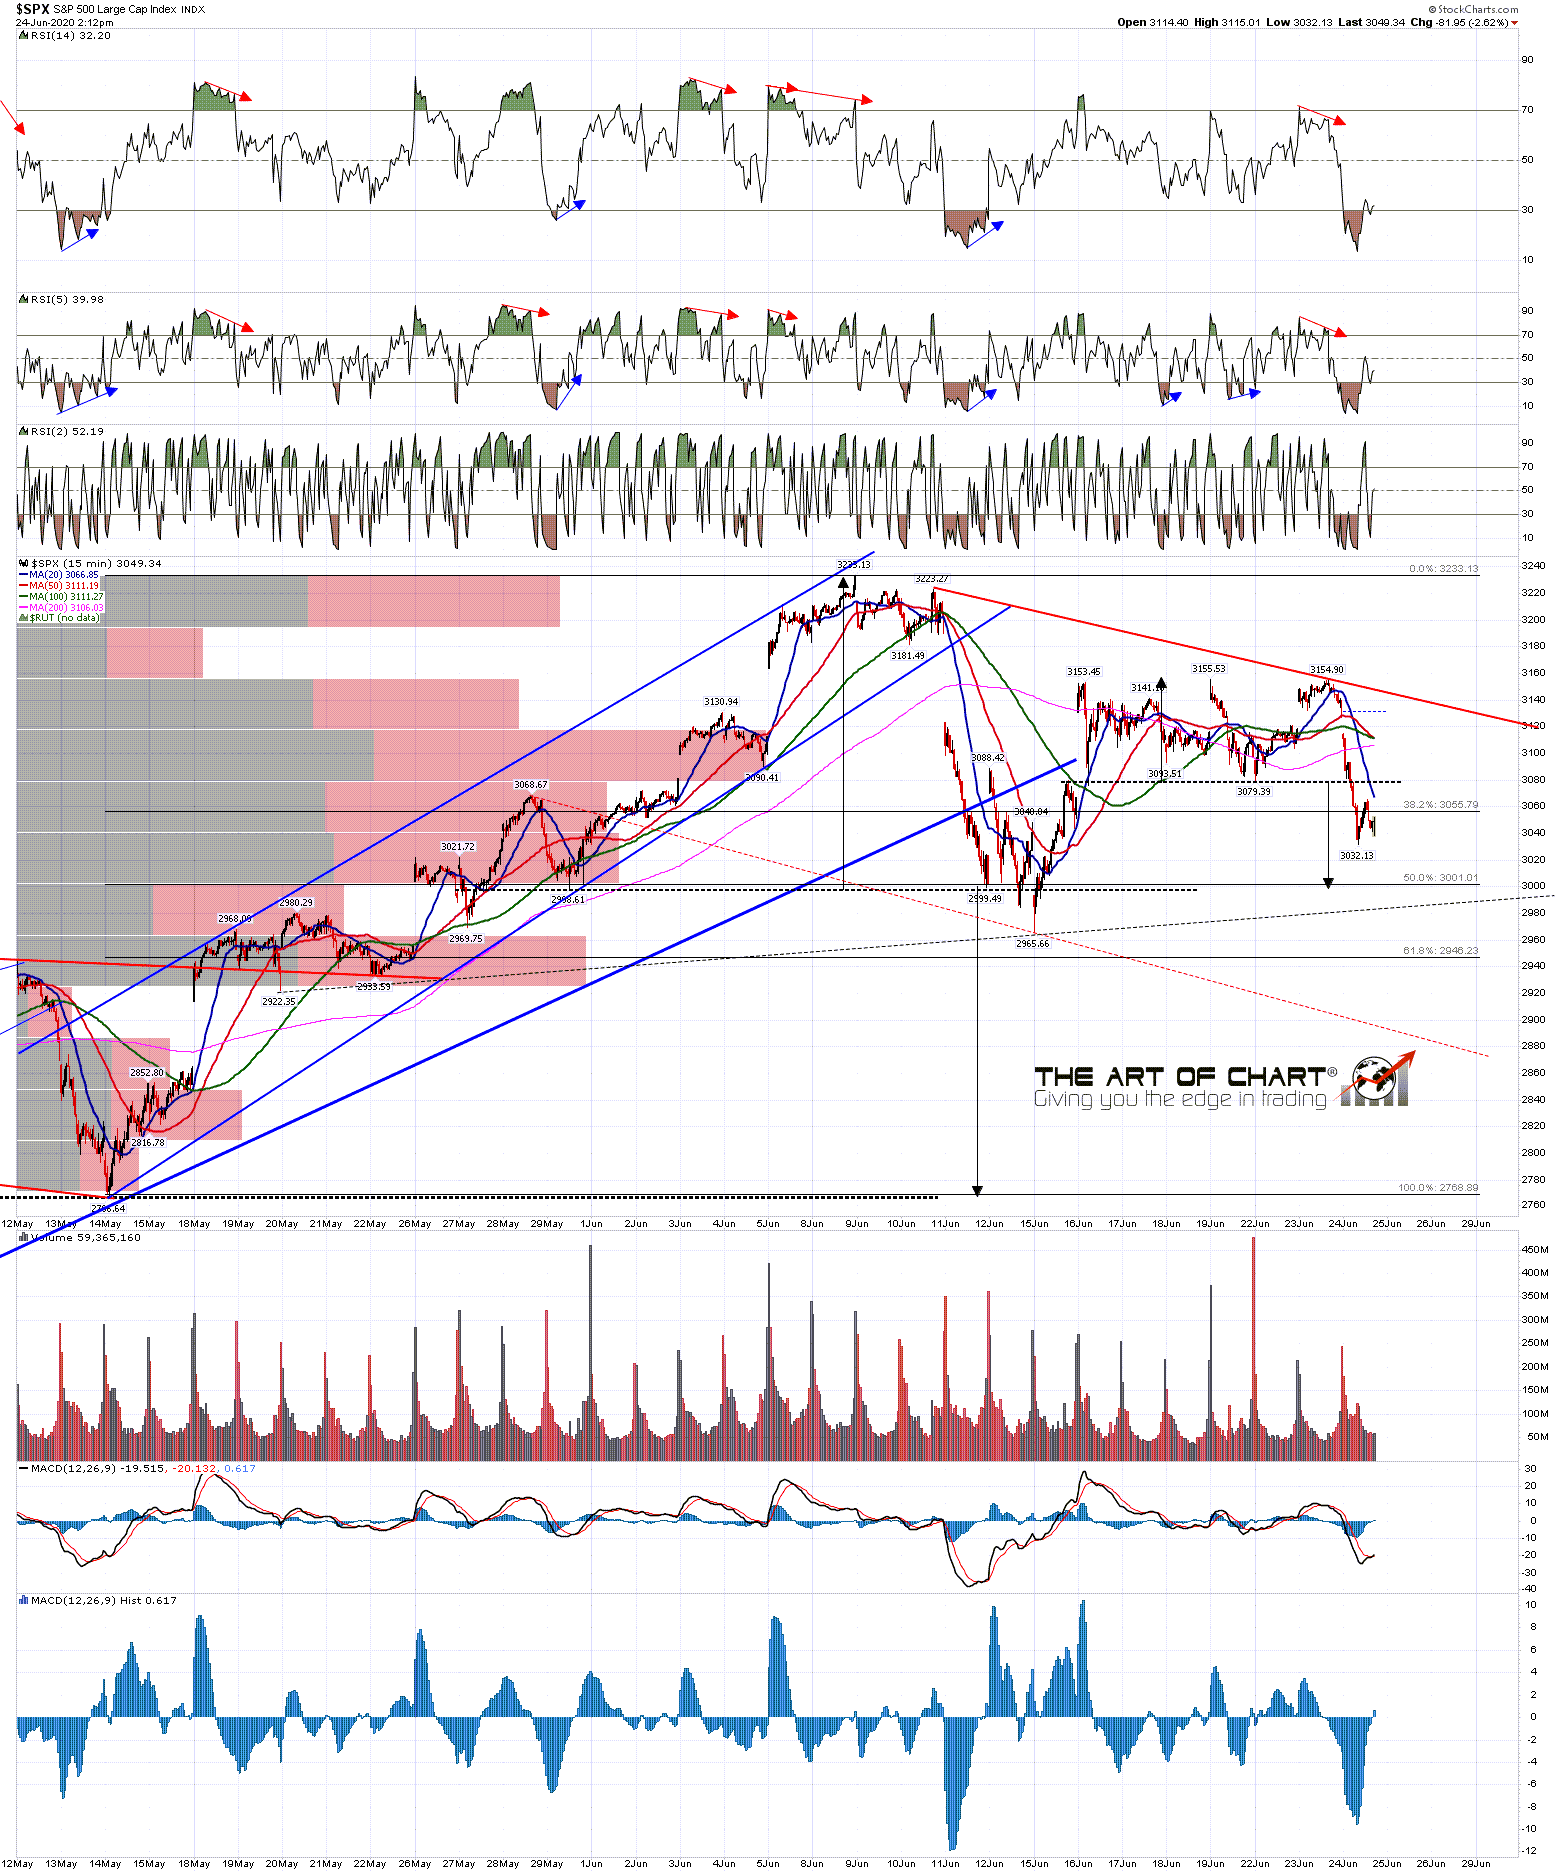
On the 15min chart the RSI 14 sell signal that formed at the high yesterday has reached target and a retest of today’s low would set a possible RSI 14 buy signal brewing. I would note the fixed double top target in the 3000 area that could be reached on a lower low today.and a possibility that SPX is getting towards the end of a wave C down on a bullish triangle that may be forming here. The lower high also raises the possibility that a bull flag may be forming here.
SPX 15min chart:
Overall the high may be in and NDX may be starting a move back to the rising megaphone support trendline currently in the 6900 area. However more evidence is needed, I’m looking for reversal patterns to form, and it is still possible to see those retests of the June highs on SPX, RTY and INDU, which could be forming bull flags or triangles to deliver those at the moment. I like the prospects for a rally tomorrow and in the event that we see lower lows towards the close today on SPX I’ll be watching for a possible long entry.
Planning at the moment to do another post on Friday.
 24th Jun 2020