
SPX has gone through a lot of trendlines and divergence on this amazing move up, with the last lot breaking on the move over the 3350 area including the negative divergence on the daily RSI.
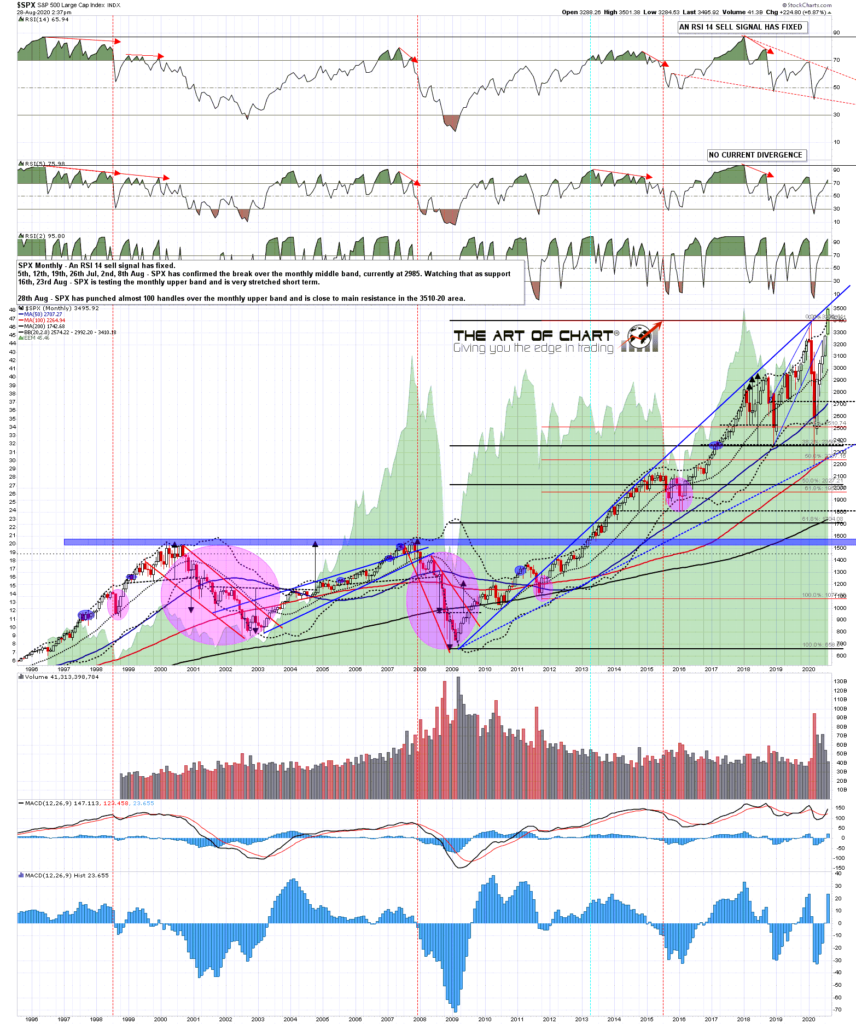
SPX is very stretched here, has punched 100 handles over the monthly upper band, touched an amazing 7.1% above the 45dma when I last annotated that chart yesterday, and is now close to testing the last and largest resistance trendline on the chart.
That trendline starts at the March 2009 low, held support at the 2010 low, and then was touched as resistance at highs in 2011, 2012, 2014, 2017/8, 2020 and is now close to being tested as resistance again. That trendline hasn’t broken as resistance since SPX crossed below it in 2011, and I have it in the 3510-20 area at the moment, though that is an approximation on a trendline that is now more than eleven years old. At the time of writing SPX has reached a new all time high at 3508.07.
Is this trendline going to hold? Well we’ll see, this really has been an amazing move, but that really should hold as resistance.
SPX Monthly chart:
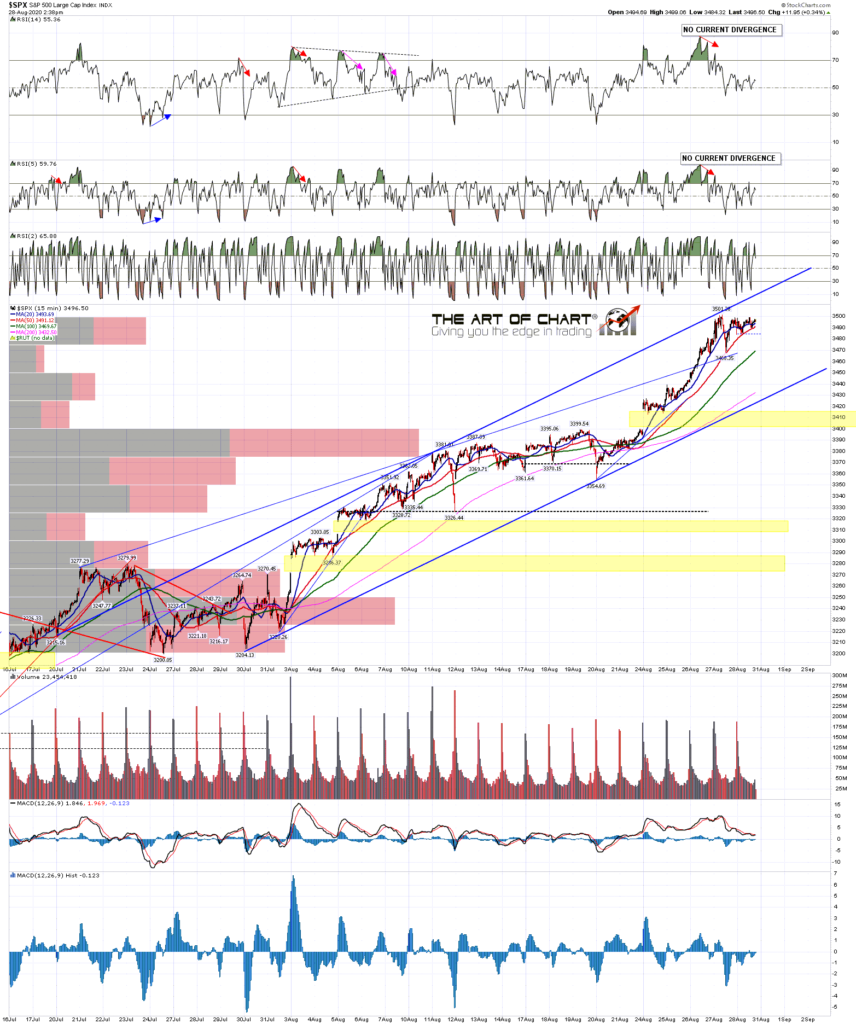
That’s a decent match with a shorter term trendline on the SPX 15min chart below so we may be seeing that test soon and I’ll be watching that with great interest.
SPX 15min chart:
On the bigger picture SPX reached an eye-watering 7.1% above the 45dma. That’s only been exceeded once at a high in the last eight years and that was in June this year. A return to the mean move cannot be far away. and might well start at a test of the main resistance trendline now only slightly above.
SPX daily vs 45dma 2017-date:

Just as an aside this last phase up of the move from June has been a very narrow move based on tech and large caps.That’s very clear on the hourly SPX equal weighted chart which has not yet retested the June high, and is still a good 10% short of a retest of the all time high.
SPXEW 60min chart:
![]()
This is a very important test for SPX, and if resistance holds then the return to the mean retracement should start next week, and SPX may make a major high. If it does hold then I’d note that the obvious next target on the monthly chart would be a return to the rising megaphone pattern support for which that trendline is the resistance trendline. That’s currently slightly under 2300 of course.
Everyone have a great weekend 🙂
 28th Aug 2020