Firstly my apologies for the wait since my last post. I’m currently getting divorced, which isn’t much fun, and the presidential election was so polarising in the US that I was getting the impression that if I mentioned that the weather was getting chillier as the season changed, then some would feel that was a comment on the election and get offended. The election is finally over….ish, and I think it’s safe to start writing again about markets.
So in my last post I was writing about the bull flags that would likely deliver retests of the all time high as and when they broke up. Those evolved into larger bullish patterns, a bull pennant on SPX, a bull flag on INDU, a possibly still forming bullish pattern on NDX, and on Monday those broke up into new all time highs on SPX, Dow 30 and RUT, but not so far on NDX. Equity indices are still retracing from those Monday highs, so what should we expect next?
Well it has been a really crazy year on the markets, but the first thing I want to talk about is the SPX monthly upper band. At the end of August there was a serious punch over the upper band and these are rare. The chart below shows the last 25 years on SPX, including a couple of bubbles and four technical bear markets (declines of over 20% from the preceding high). In that time there have been strong punches over the monthly upper band in mid 1997, early 1999, mid 2007, early 2011, early 2017, late 2018 and late 2019. In none of those seven examples was there another close above the monthly upper band in the next few months, and that is currently in the 3548 area and rising at maybe 20 handles per month. Historically upside on SPX over the next few months is likely limited, and favors both November and December closes this year under 3550. Two of these punches delivered topping processes into full bear markets lasting longer than a year not long after, and a further three delivered retracements back to the monthly middle band, now at 3085, with retracements in the 20% area.
Bottom line is that the odds strongly favor SPX making a high here, and the high is possibly made, but more likely just close.
SPX monthly chart:

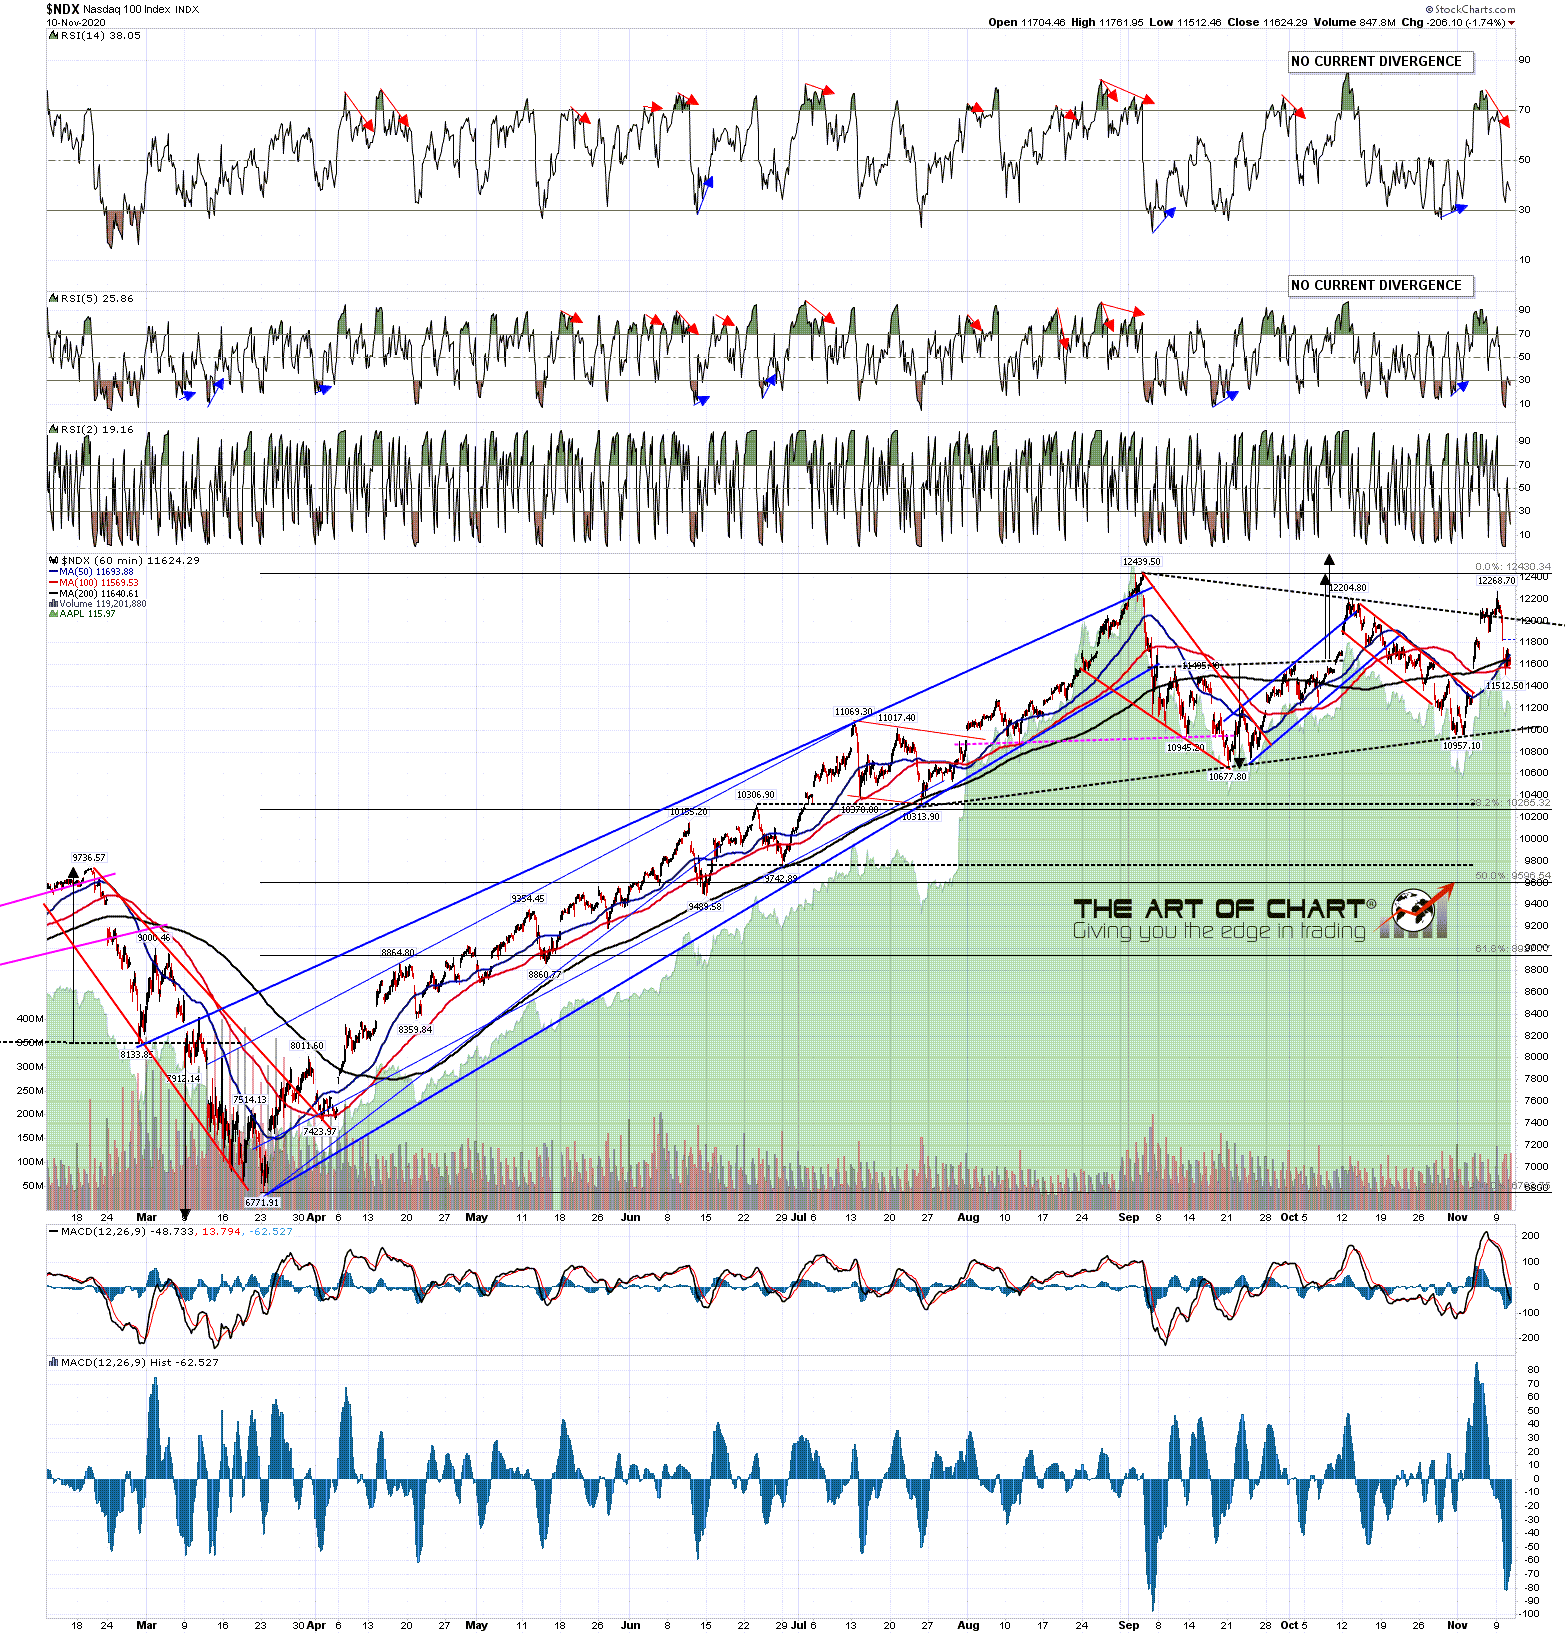
The exception to the new all time highs on equity indices on Monday was NDX, partly as there is now a coronavirus vaccine on the horizon and there is a consequent rotation out of the tech stocks that have been benefiting from the lockdowns. That said, this is a pretty obvious bullish flag setup on NDX from the all time high and the obvious target remains a retest of that high. That looks like unfinished business above and we will likely still see that retest either soon or within a couple of months.
NDX 60min chart:
 On SPX there was an excellent triangle that I was talking about in the free monthly Chart Chat at theartofchart.net on Sunday. If you’d like to see that recording then that is posted on our November Free Webinars page. We would usually see some daily negative divergence at a high so I’m leaning towards seeing a retest of Monday’s high before a likely November close below the monthly upper band currently a hundred handles below.
SPX daily chart:
 Here’s the lovely bull triangle on SPX that I was looking at on Sunday. That has now reached the minimum target at a retest of the all time high. SPX 60min chart:
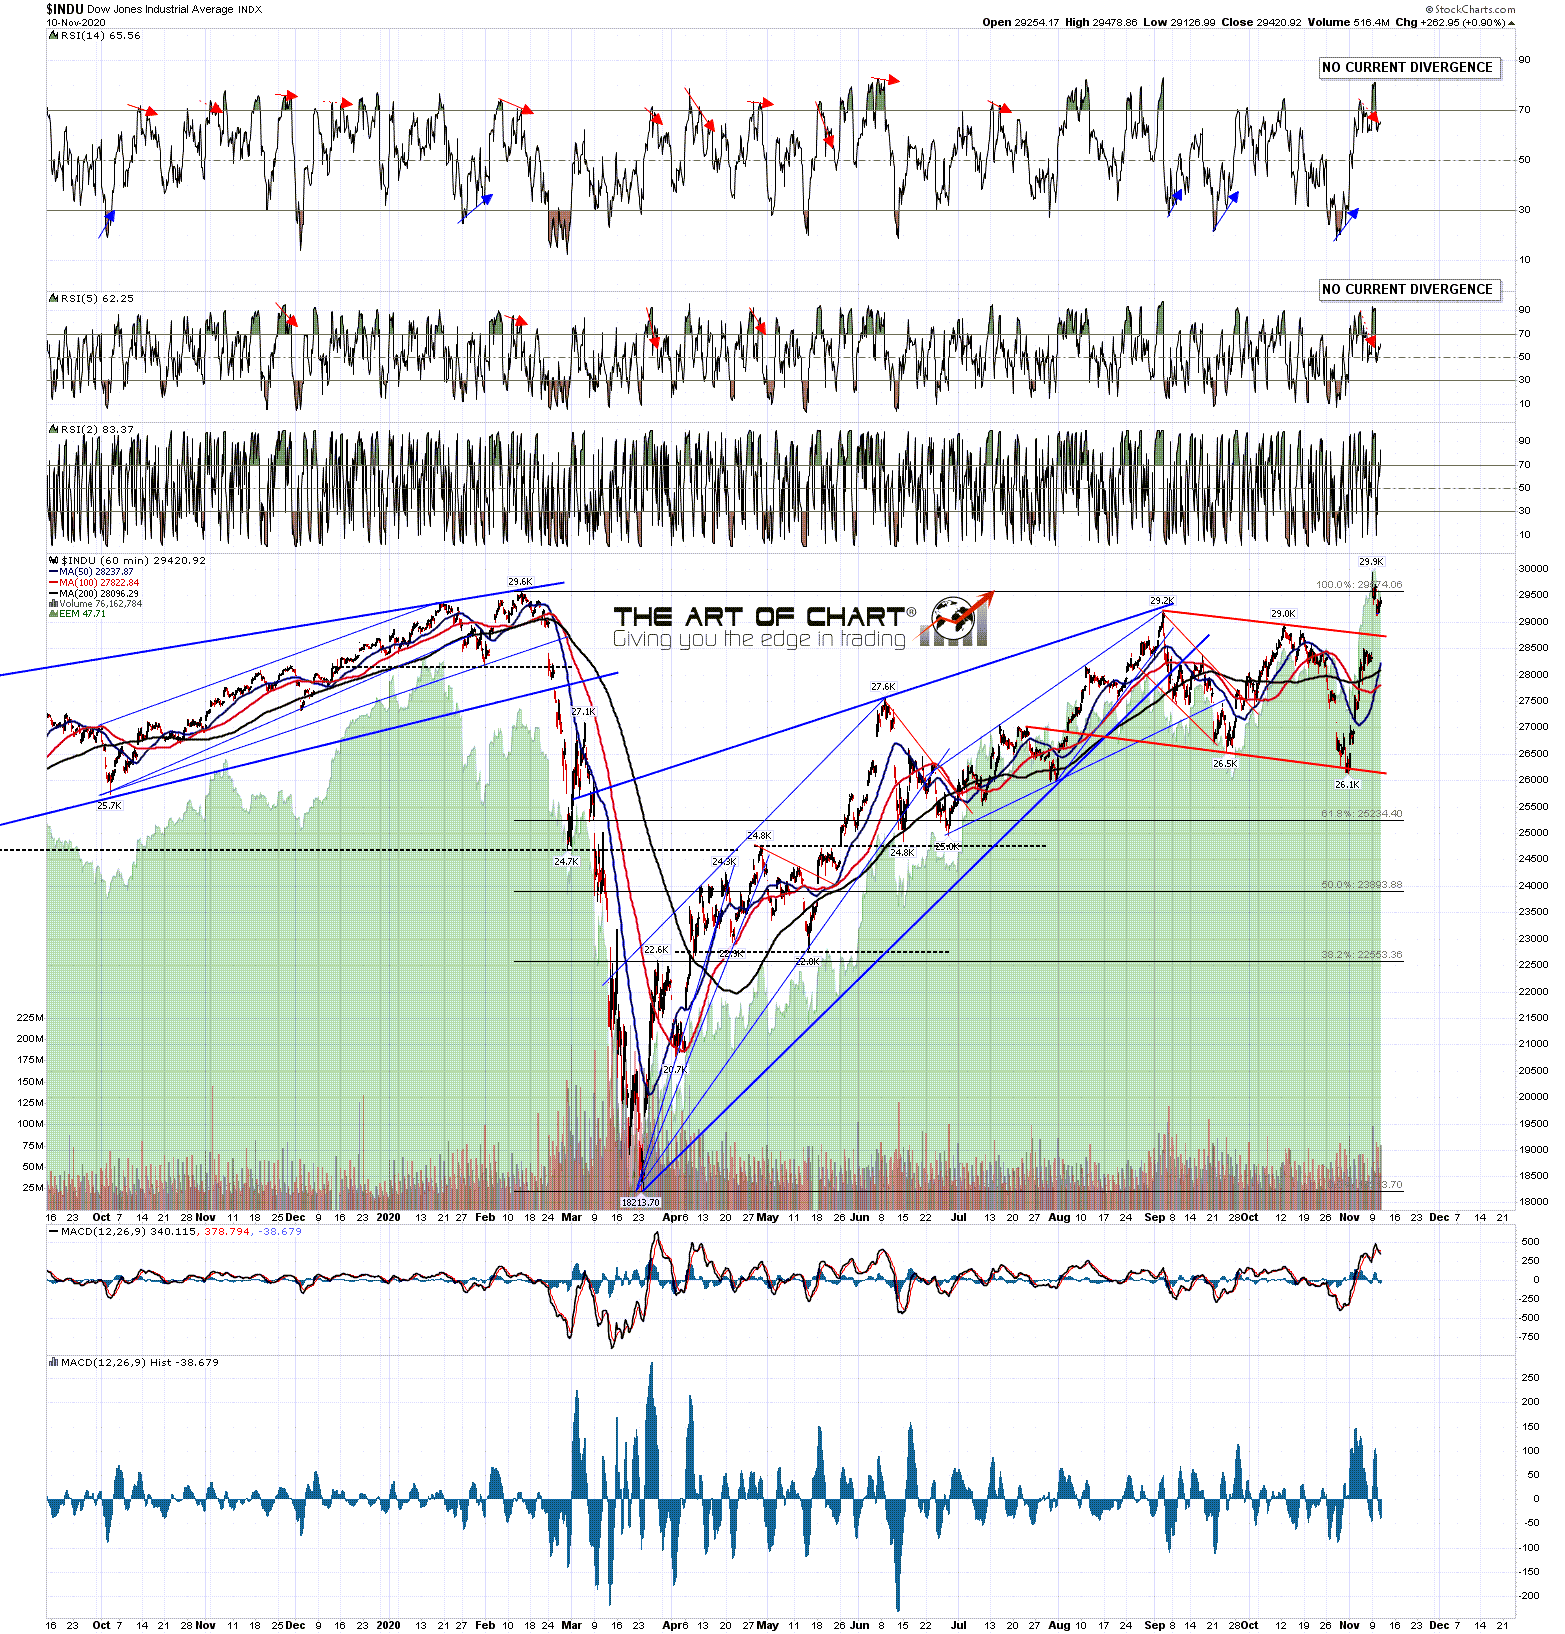
 Here is the bull flag megaphone on Dow Industrials that has also made the minimum target at a retest of the all time high.
INDU 60min chart:
 I was saying on my premarket video yesterday morning at theartofchart.net that I’d like to see another day or two of retracement to deliver a decent decline on the SPX daily RSI 5. That’s posted on my twitter if you’d like to see it. After that I’m leaning towards a high retest so we’ll see how that goes. I’m resuming regular posts now and the next post should be later this week to review progress.
 11th Nov 2020