On Friday morning I was looking at the short term bull and bear options on SPX and at support and resistance levels being tested. The main resistance level was of course the weekly middle band, now at 4518 and with the SPX close on Friday at 4488, just above support at the daily middle band, there was a complete failure to break back up over that resistance.
SPX weekly chart:
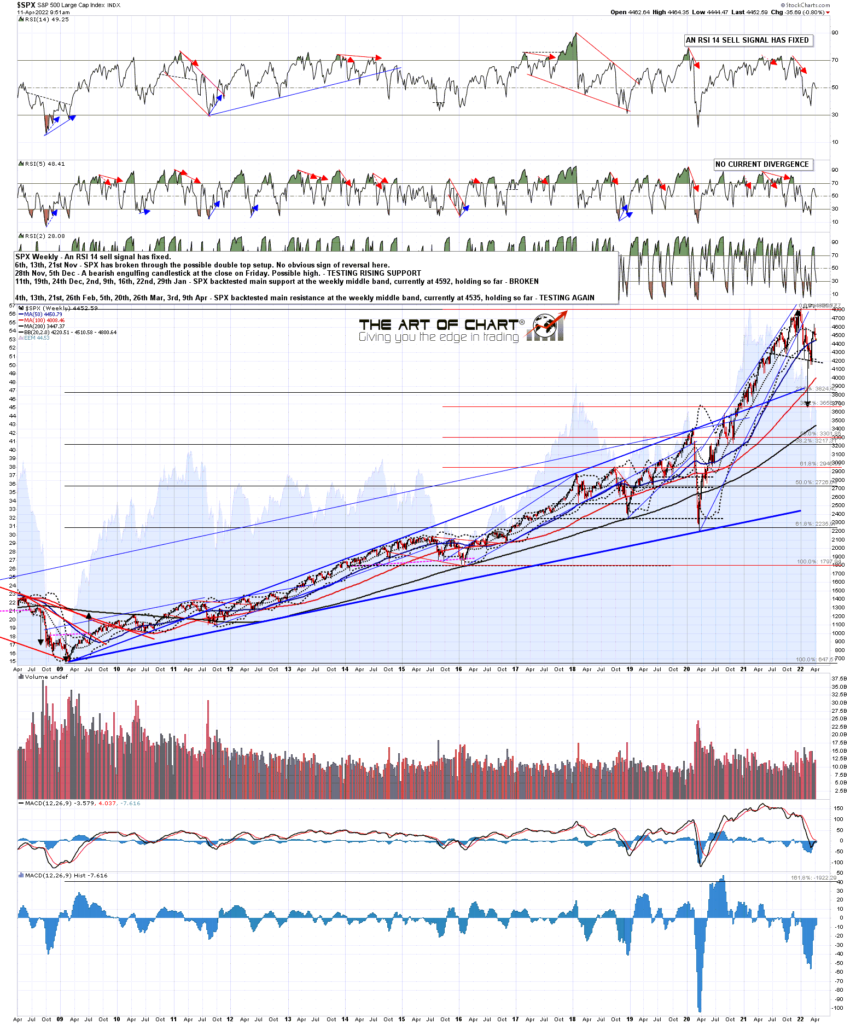
That has led into the test of key support that we are now seeing on SPX and NDX particularly this morning. The most important short term support level on SPX is of course the daily middle band, now at 4495, and SPX opened well below that this morning. A clear daily close below that today would be a significant strike in favor of the downside option here.
SPX daily BBs chart:

So what is the downside option? Well on Friday morning I was looking at the possible H&S forming on SPX here and that H&S has now completed and broken down at the open this morning. If SPX can sustain that break then the H&S target is in the 4265-70 area. If we see a rejection here then a break back up over the right shoulder high at 4521.16 would fail the IHS, looking for a retest of the previous high at 4637.30, and break up from a double bottom looking for a target in the 4600-10 area.
We should see a clear break up or down from this inflection point area on SPX very soon and that may well happen today, particularly if SPX breaks down.
SPX 15min chart:

On NDX the setup is messier. I have marked in the slightly more bearish H&S option that has broken down with a target in the 13420 area. A break back over 14630 should fail both of the H&S options here and would be a significant bullish break and likely look for a retest of the previous high at 15625. Conversion of the broken neckline at 14300 to resistance would strongly favor the downside.
NDX 15min chart:
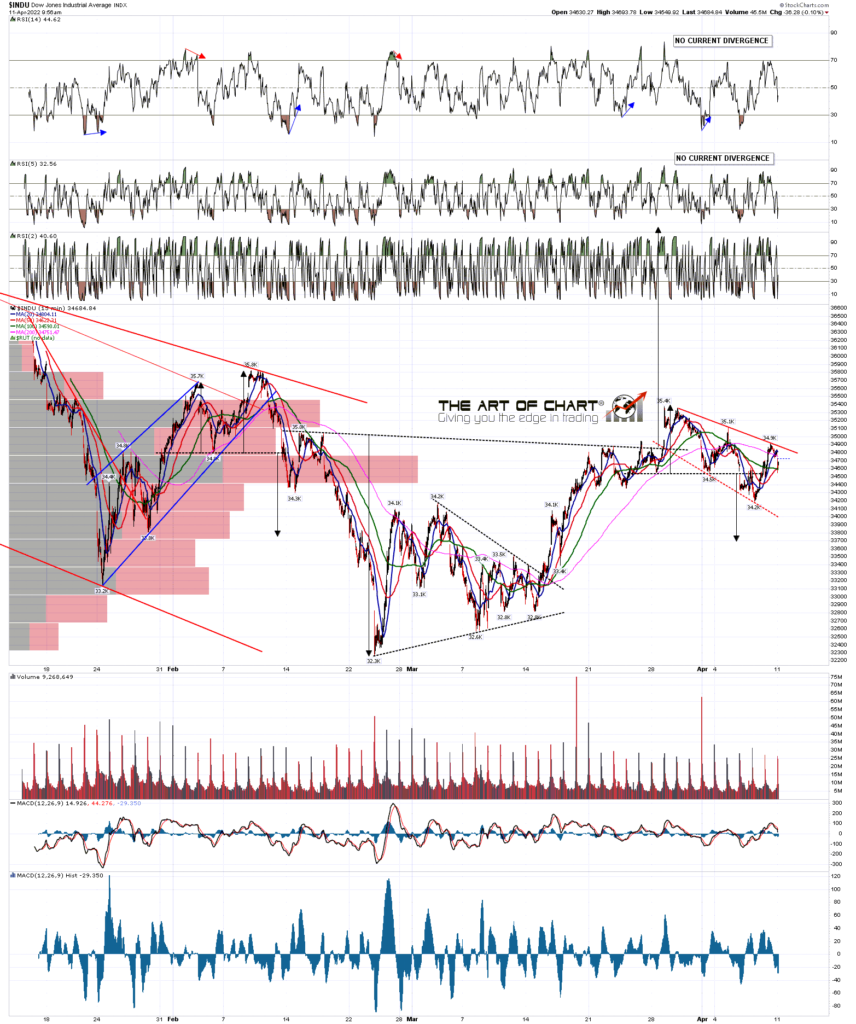
The Dow is looking more bullish here, with perfect tests on Dow and YM of the possible bull flag resistance trendline on Friday. That would look bullish on a break up over that trendline and a subsequent break over that H&S right shoulder high at 35.1k would then look for a retest of the previous high at 35.4k.
INDU 15min chart:
Overall I’m still leaning towards the short side here. The news on Ukraine continues to be grim and there’s no obvious sign that will be changing anytime soon. The news on sanctions is suggesting that those may intensify a lot in coming weeks, with a possibility it seems that most energy purchases from Russia by Europe may be ending soon, which may have a serious impact pushing energy prices up and very possibly equity prices down as inflation then rises further, the cost of living crisis intensifies, and western economies are pushed closer to recession. There is also of course still a Three Day Rule target at a retest of the 4114.65 low.
We’ll see whether this current break down can be sustained into the end of the day. If so, and there is a confirming close below the daily middle band tomorrow, then the next likely move on SPX should be to 4270, putting SPX within striking distance of the 2022 low at 4114.65.
We did our monthly free public Chart Chat on Sunday at 4pm EST looking at the prospects for equity indices here as well as the usual wide range of other instruments and markets. If you’d like to see the recording you can see that here. As always you can also see the recording on our current monthly free webinars page.
 11th Apr 2022