As of last weekend our Follow The Leader service at theartofchart.net was up 159% year to date with 90% winners so far. This is an autotrading service in partnership with GFF Brokers, official broker for the World Cup Advisor Auto Trade programs. This is included in our Daily Video Service and if you’re interested in that you can find out more about that here, and you can try a 30 day free trial at theartofchart.net here.
I was looking at the possibility on Friday of a decent rally from strong support in the 3600 SPX area, and that rally may well have started. On the SPX daily chart both RSI 14 and RSI 5 buy signals have fixed yesterday and there is a clear bottoming pattern here that could take SPX back up into the 3885 area on a sustained break back up over 3736.
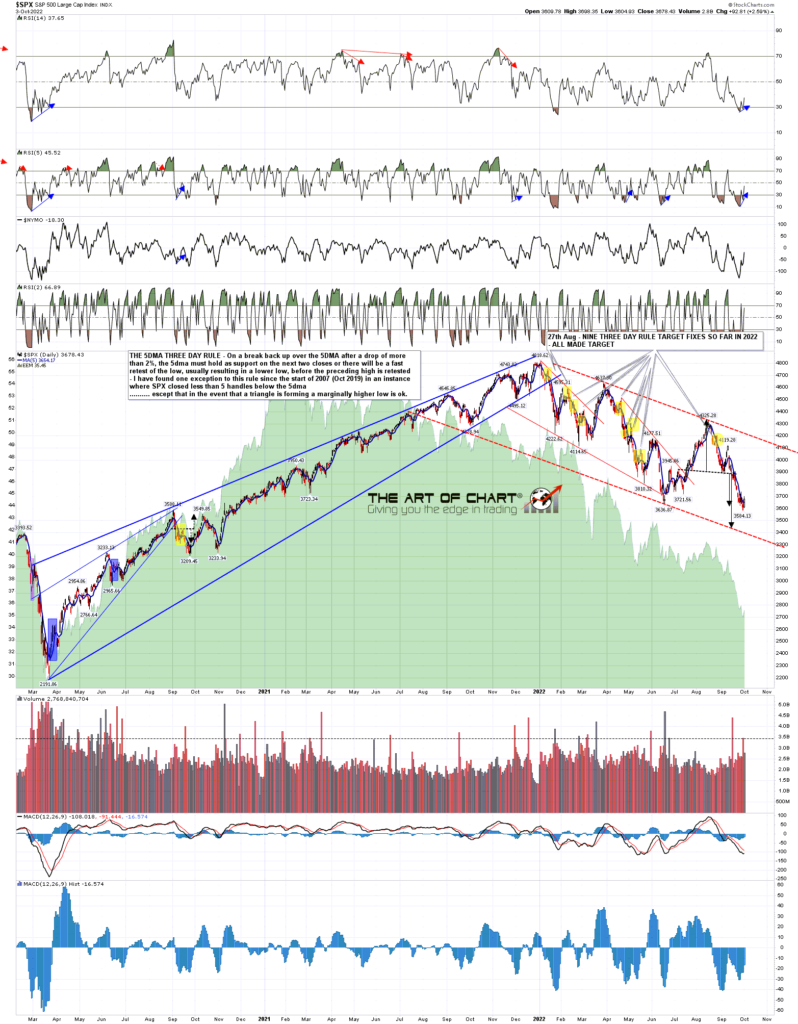
SPX daily chart:

For the second time in the last week SPX has delivered a closing break back up over the 5dma, so SPX is back on the Three Day Rule. That means that if we see a clear close back below the 5dma, currently at 3654, either today or tomorrow, then we should see a retest of the recent low at 3584.13 before a retest of the September high at 4119.28.
I didn’t mention the Three Day Rule in a post last week because that low retest target was made at the same time the target fixed with the close back below the 5dma, but that is fairly unusual. I haven’t marked that on the chart as I just disregard these when they happen.
SPX daily 5dma chart:
Why is this 3600 area support so significant? Well history as ever. Everyone watches the 200dma but the 200 week MA is just as, or even more, significant and that is currently in the 3595 area.
On the weekly chart below you can see the 200 week moving average on SPX over the last fourteen years. After the 2009 low the high in 2010 tested it as resistance, then it was support at the lows in 2011, 2016 and 2018. It was broken hard though briefly in the 2020 crash and now it is being tested again. Apart from the 2011 lows where it was tested and repeatedly pinocchioed over multiple weeks, and the break in 2020 of course, it held almost precisely at the other tests in 2010, 2016 and 2018.
This is likely the most important bigger picture moving average on SPX and while there is good reason to think this might break later in the year, it is a very obvious place to see a strong rally now.
SPX weekly chart:

So where might this rally be headed? Well the first obvious big targets are backtests of the daily or weekly middle bollinger bands on SPX. The lower of those is the daily middle band, now at 3832, and the higher is the weekly middle band now at 3948.
SPX daily BBs chart:
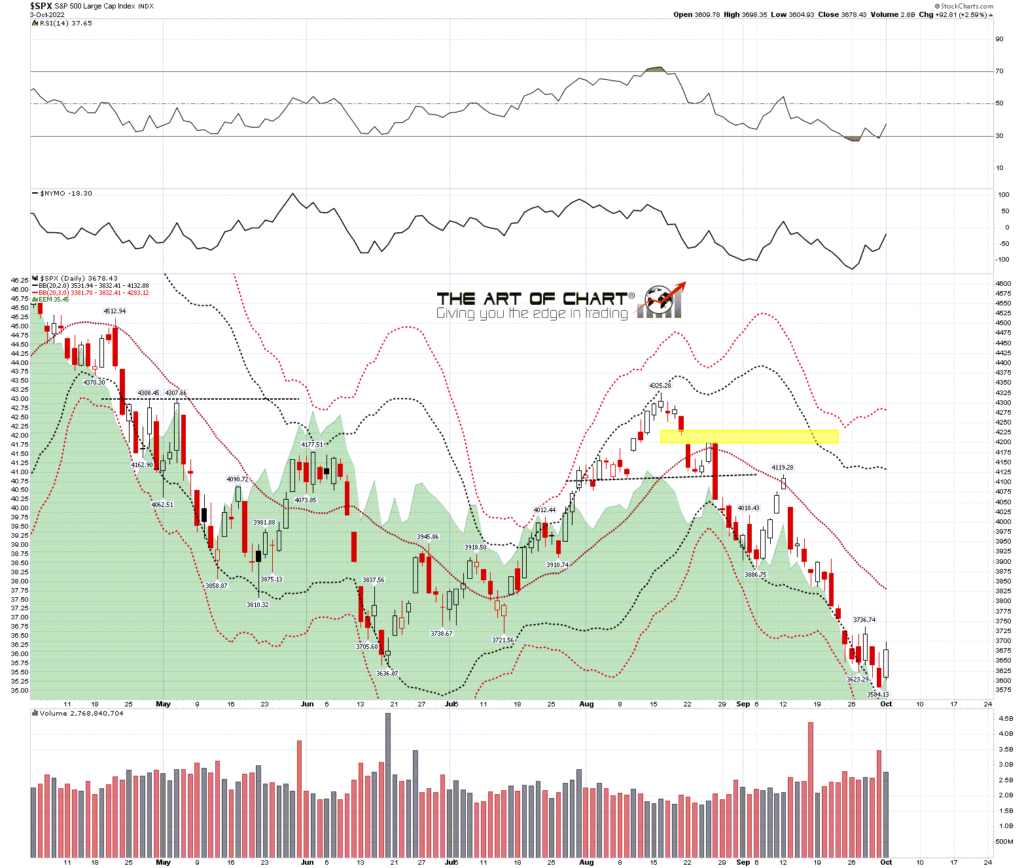
There is also a reversal pattern here of course, and that is an asymmetric double bottom on SPX with double bottom resistance at 3736.74 and alternate targets in either of the 3850 or 3900 areas. That is backed up by an even nicer double bottom on Dow where daily RSI 14 and RSI 5 buy signals both also fixed yesterday.
That reversal pattern on SPX isn’t a bad fit with declining resistance from the rally high at 4325.28. That’s now in the 3935 area and declining of course. That trendline is just under the weekly middle band and is the most obvious target for this rally if SPX can break and convert double bottom resistance at 3736.74.
SPX 60min chart:
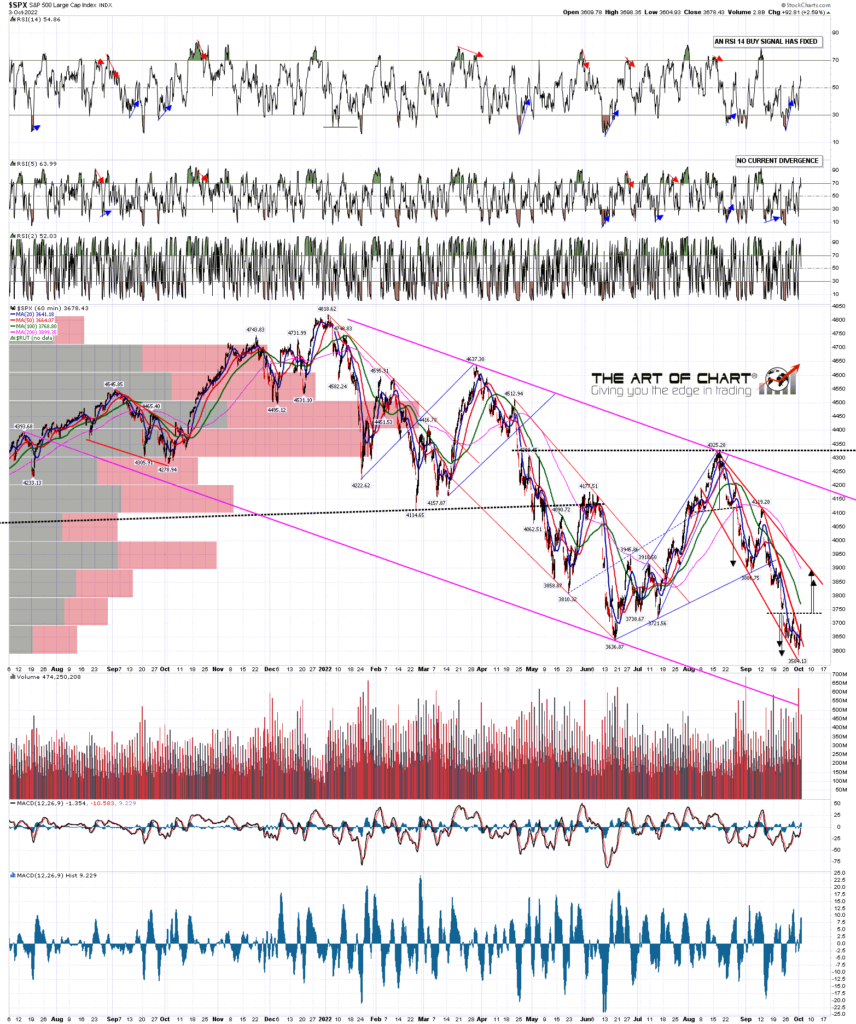
I’m still keeping an open mind on a rally here. The setup is solid but the news is grim and a strong enough trend will run over divergence and reversal setups. The market rarely goes up or down in a straight line though and from a technical perspective this rally setup is really very nice indeed. I like it a lot so we’ll see what happens at resistance today.
Our monthly free public Chart Chat at theartofchart.net is at 4pm EDT on Sunday and if you’d like to see that you can register for that here or on our October Free Webinars page.
My next post should be on Thursday or Friday before the open. 🙂
 04th Oct 2022