I posted the chart below on my personal twitter yesterday morning with the comment that a retracement was likely and that a possible rally high was being made.
I was looking at the perfect hit of the ideal possible rising wedge resistance trendline for this move and the very large amount of negative divergence on the hourly and 15 minute charts.
A higher high was then made that overthrew the wedge slightly and improved the hourly negative divergence further, and since then we have seen a modest retracement which looks likely to go further.
SPX 15min chart (yesterday):

Looking at the same chart now, the obvious next target is a test of rising wedge support from the low, now in the 3740 area. The retracement yesterday reached a possible H&S neckline, and if we should see either a right shoulder high form here (ideal high 3855 area), or a retest of yesterday’s high, then that would set up a reversal pattern that on a sustained break below 3825 would look for a target in the 3765 area.
I would note further that the overthrown rising wedge may be a bear flag from the low, and that the overthrow suggests that the wedge is topping out before it breaks down.
SPX 15min chart:
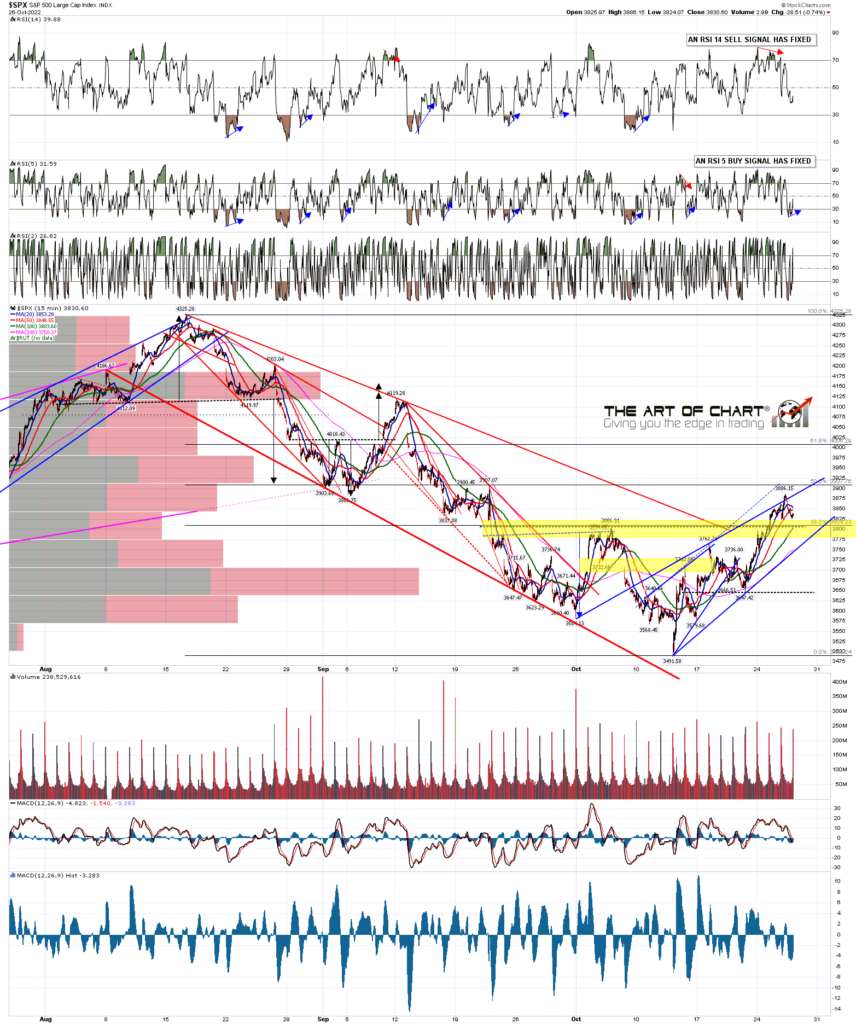
Obviously the Three Day Rule failed on the break over 3806.91, which was has broken the perfect track record of this stat since the start of 2007. I did mention repeatedly that there is no such thing as a sure thing, and that we would see a fail on this at some point, and so we have.
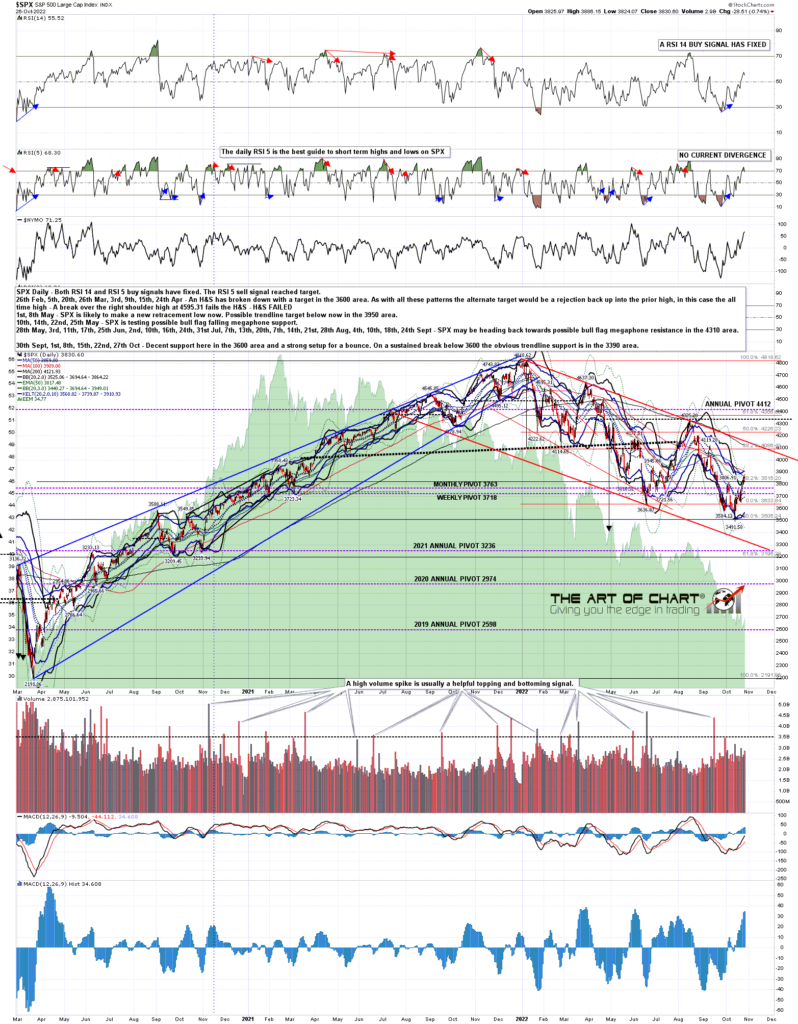
What this did resolve though was the oddity I mentioned that if the Three Day Rule did deliver as usual, then the daily RSI 5 buy signal would be unlikely to reach target, which they generally do. On the break over 3806.91 that signal did then make target, and there is now the possibility that if we see a decent retracement here, then a retest of yesterday’s high, then we can see a possible daily RSI 5 sell signal start brewing. If SPX is going to head back to the lows next, that would be a good way to set up that decline.
SPX daily chart:
On the hourly chart the higher high yesterday delivered an hourly RSI 14 sell signal that has fixed and not yet made target. These too tend to be reliable signals, with twelve of the last fourteen having reached target. I am expecting this one to make target too.
In terms of retracement targets an obvious target on any decent retracement is the hourly 50 MA, currently at 3756. If a topping pattern forms here along the lines I was looking at above, that would be a decent match with the target.
SPX 60min chart:

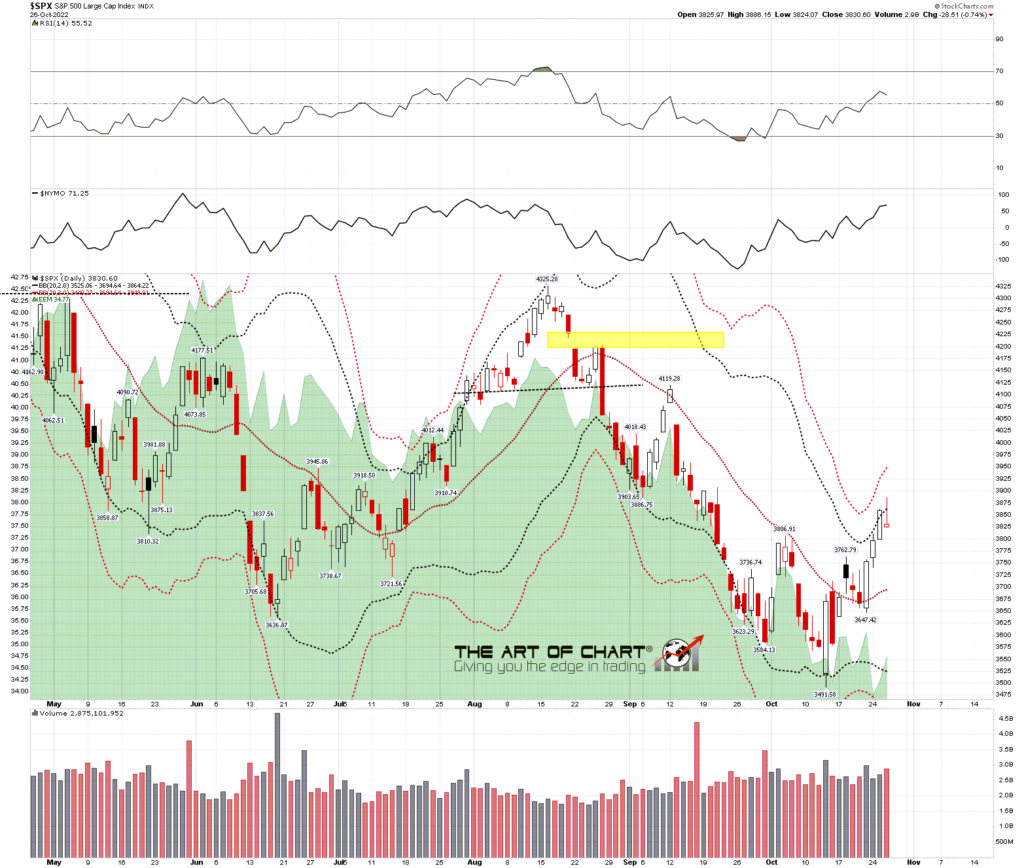
If we see a break of the 50 hour MA on this move then the next big level of support would be at the daily middle band, now in the 3695 area.
SPX daily BBs chart:
We are doing our usual monthly public webinar of FAANG stocks and key sector ETFs tonight an hour after the close. It should be interesting. If you’d like to attend you can sign up for that here or on our October Free Webinars page.
If today is particularly interesting then I may do another post tomorrow morning. Otherwise my next post should be on Monday or Tuesday before the open. In that case, everyone have a great weekend. 🙂
 27th Oct 2022