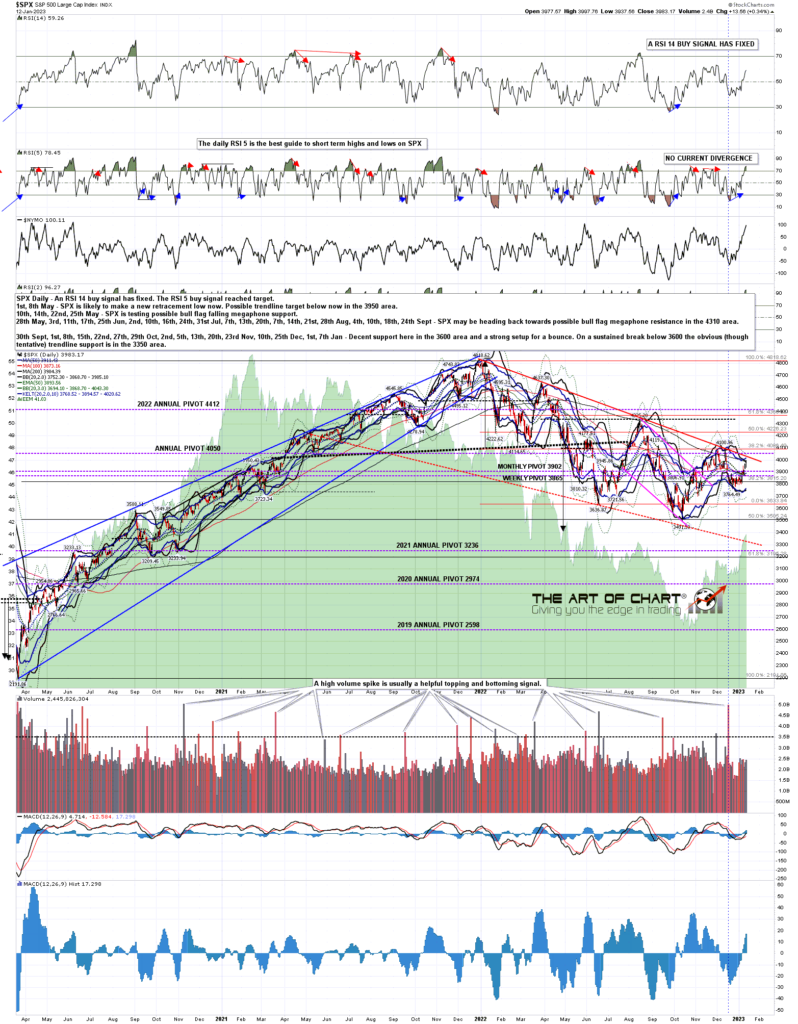
I mentioned in my post a week ago that on a break back over the daily middle band there were fixed buy signals on the daily and hourly charts that might carry SPX significantly higher and so it was, with SPX hitting 3997 at the high yesterday, and those buy signals have now all made target. I’m looking for signs of a high forming, and there are some signs here.
There is no negative divergence on the daily chart here yet, so I’m thinking we might see a sharp retracement here back into the daily middle band, currently at 3868, then retest the high to set up a possible double top.
SPX daily chart:
On the 15min chart there was a sloppy IHS that broke up with a target in the 3400 area, and the high yesterday was close enough that I’m treating that target as reached.
SPX 15min chart:
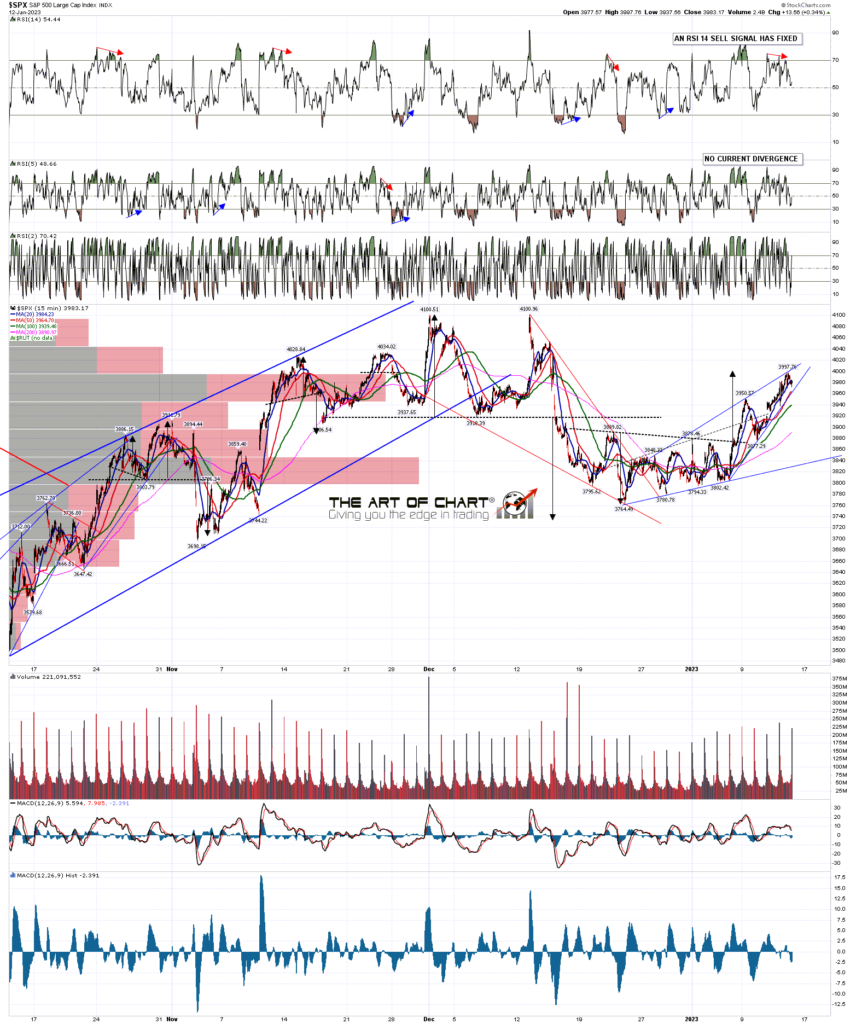
On the hourly chart both RSI 14 and RSI 5 sell signals may be brewing here, and looking at the overnight action both of those may fix at the open. There is a possibility of course that the high for this move was made yesterday. If so I’ll be watching the possible H&S necklines in the 3940 and 3880 areas.
You can see that declining resistance from the high is now in the 4035 area. I would be surprised to see that broken after the perfect hold at the rally high in December. If that is going to hold as resistance on this move then this short term high is close or already made.
SPX 60min chart:

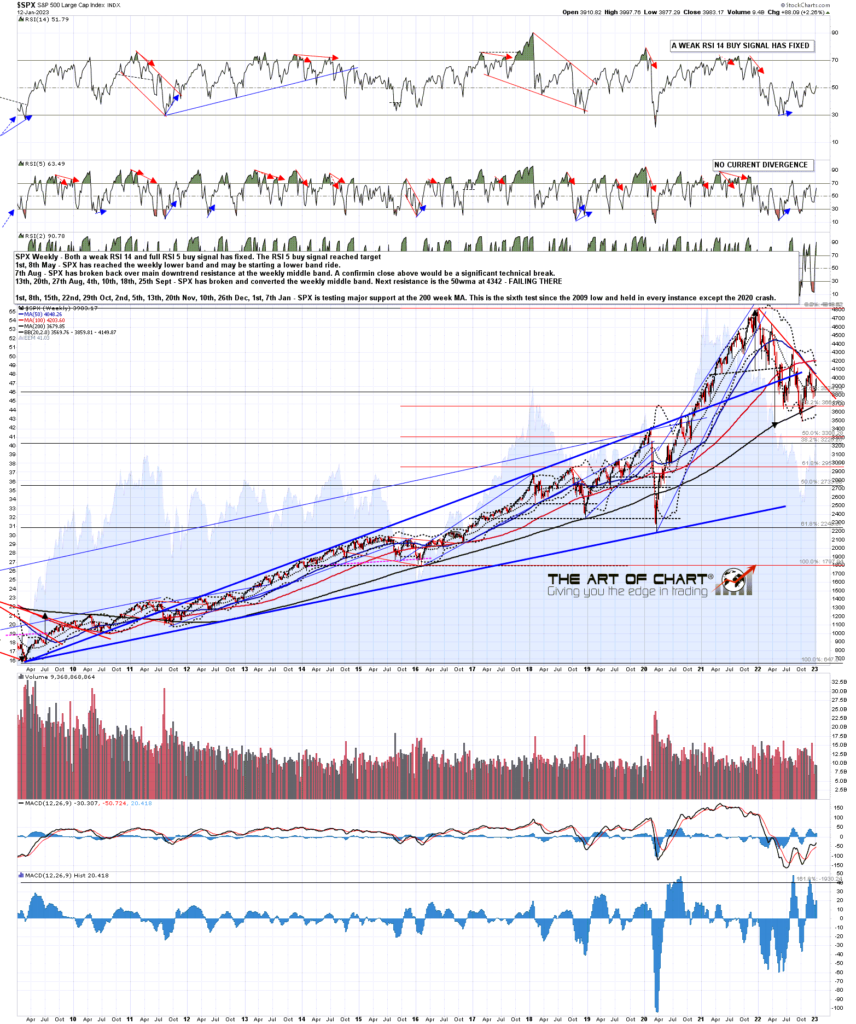
On the weekly chart main resistance for this downtrend is at the 50 MA, and that is now in the 4047 area, just above declining resistance. Unlike declining resistance from the all time high, that would be more complex to break, needing a break and conversion to support, but both major rallies last year failed there almost exactly.
SPX weekly chart:
If we have already seen the high on the short term move, the clear signal that it was finished would be a break and conversion of the daily middle band, now at 3868. If this retracement gets that far then I’ll be watching that carefully.
SPX daily BBs chart:

We held our free monthly public Chart Chat at theartofchart.net last Sunday and we included our forecasts for 2023 on a wide number of indices and sectors, as well as our top picks for the year. If you’d like to see that you can see it here, or on our January Free Webinars page.
Today is one of the rare trading days to fall on Friday the Thirteenth. Is that significant? I’ve been watching these for quite a while and, as they seem to trade much like any other Friday in the main, not particularly.
My next post should be on Monday or Tuesday before the open. Everyone have a great weekend. 🙂
 13th Jan 2023