I’m finding it difficult to get back into doing more than one post a week. I shall try hard to get two out next week.
On SPX a week ago I was looking for a reversal under declining resistance from the all time high, and ideally a decline and high retest to set up a possible daily RSI 5 sell signal. I got the first of those but not the second.
The decline from the high was too large to set up the RSI 5 sell signal and as time goes by, unless we are going to see a break of declining resistance from the all time high, a high retest is looking less likely as soon it might need to break that resistance to retest the current high.
Unless we are going to see that break then the short term high is likely made, and I’m watching a possible H&S pattern that may well be forming here with a target that would take SPX back to the last short term low at 3764.99.
SPX daily chart:
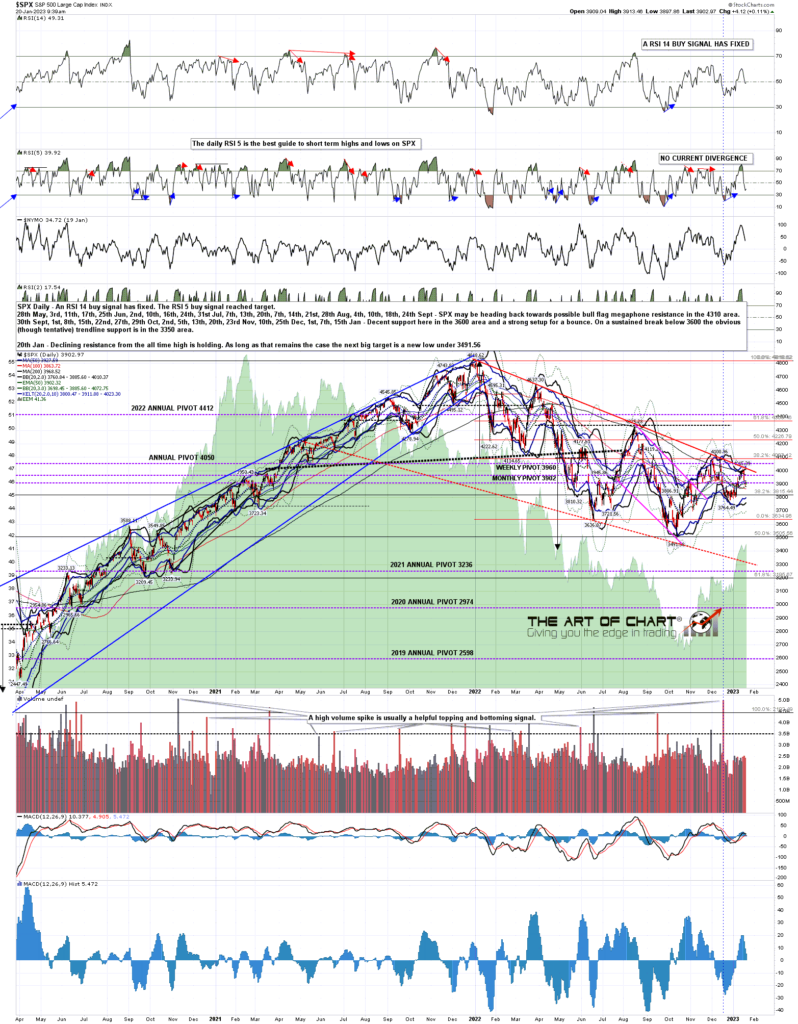
On the weekly chart main resistance at the 50 week MA held again, currently at 4036.42, and if the short term high is made then then next obvious target is another test of main support at the 200 week moving average, currently at 3568.75. If bears can manage to break and convert this to resistance then this would open potentially much lower targets.
SPX weekly chart:

In the short term SPX is rallying at the daily middle band, now at 3881.54, which is the obvious level to see a rally. If the short term high is in, this will then need to be broken and converted to resistance to open up lower targets.
SPX daily BBs chart:

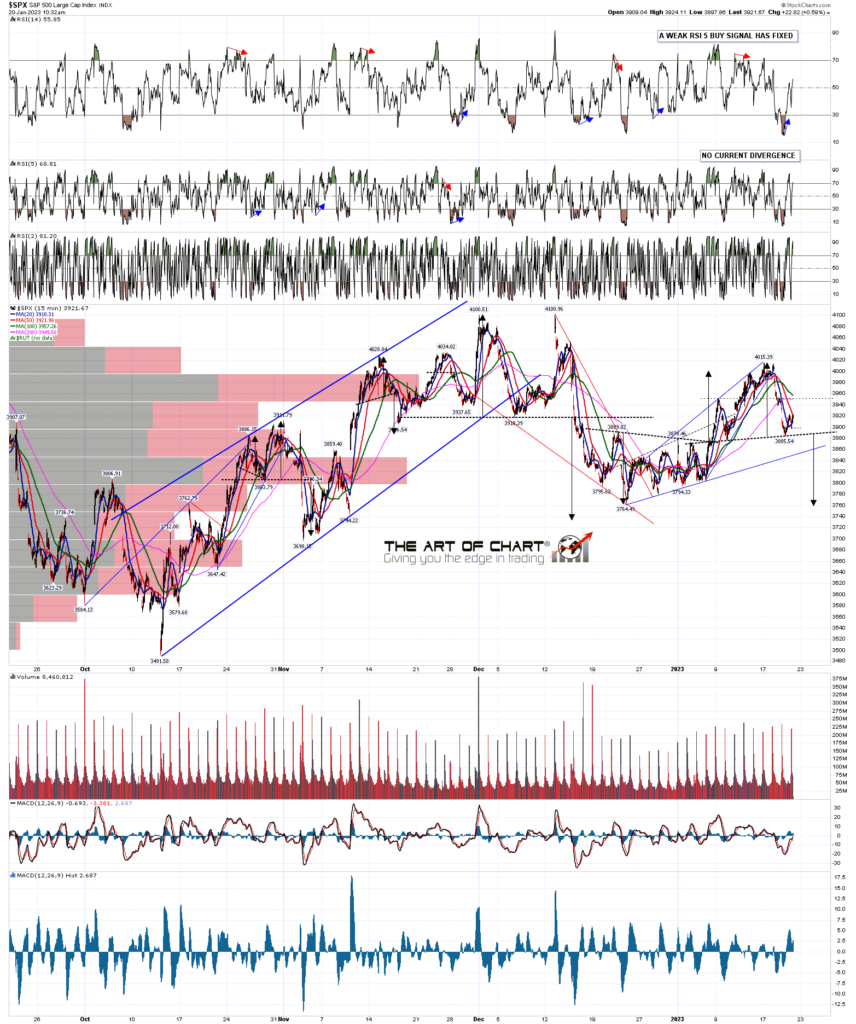
The hourly RSI 14 sell signal that was brewing last week fixed and made target. No buy signal at the low larger than the weak RSI 14 buy signal that has fixed on the 15min chart.
You can see that declining resistance from the all time high is now in the 4025 area, just a few handles above the January high so far at 4015.39.
SPX 60min chart:

What I think may well be happening here is that this rally is establishing a right shoulder on a possible H&S that if it forms and makes target would look for a retest of the December low at 3764.49. Ideally the right shoulder high would be in the 3950 area and I will be looking for a possible high there.
SPX 15min chart:
We are are holding our monthly free big five and key sectors webinar an hour after the RTH close at 5pm EST next Thursday 26th January. If you’d like to attend you can register for that here or on our January Free Webinars page.
I will endeavour to ensure that my next post is on Tuesday or Wednesday before the open. Everyone have a great weekend. 🙂
If you are enjoying my analysis and would like to see it every day at theartofchart.net, which I co-founded in 2015, you can register for a 30 day free trial here. It is included in the Daily Video Service, which in turn is included in the Triple Play Service.
 20th Jan 2023