As mentioned in my previous post, S&P 500, Sign Posts of the Coming Correction , indexes are setting up for a downdraft through mid-July. Here is what the charts are saying about the Russell:
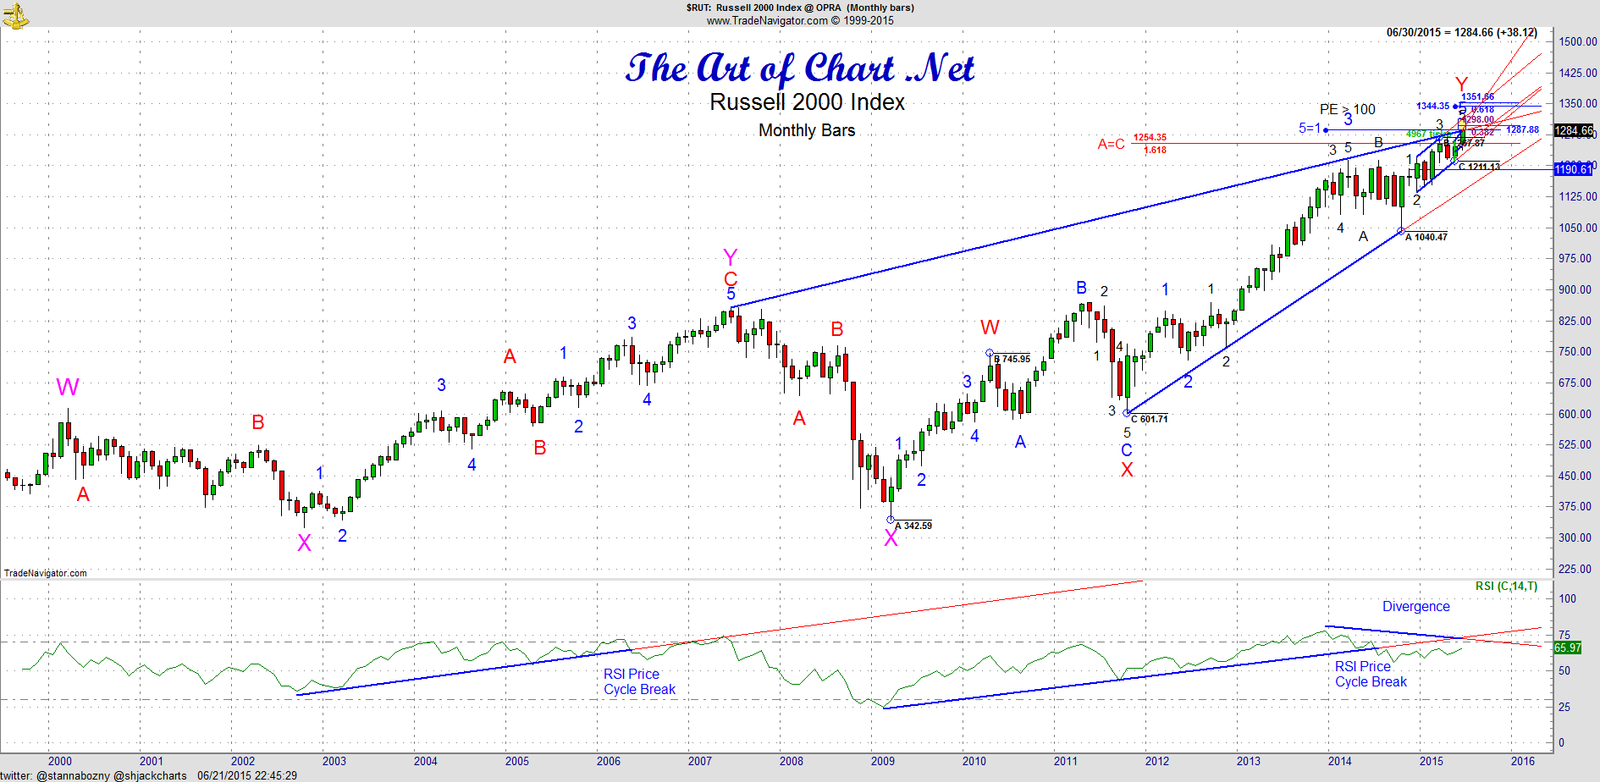
Russell 2000, Monthly Chart – A few big picture notes:
1. RSI Monthly Price Cycle break occurred back in mid 2014 – it usually takes about a year or for divergence to show up after this break. Divergence is here now, classic sign of a 5th wave. Note what happened in 2006, we broke the RSI price cycle then went on for about 12 months before putting in the final high.
2. This appears to be an expanding diagonal triangle W-X-Y-X-Z? on monthly basis and the rising resistance trend line was hit today. Can we pinocchio through? Likely we will.  We also punched the upper Bollinger on a daily basis. We are currently at resistance and over bought. A short term pullback is in store.
3. This formation calls for a thrust from the low in 2009, from there we have seen a W-X-Y (here now) then X and Z. More below.
4. From the red X we have 5 waves up and are completing wave 5 of 5. The 5=1 target is 1287.88 and we hit 1287.07 last Friday. Short term A=C target is 1293 which we hit today.
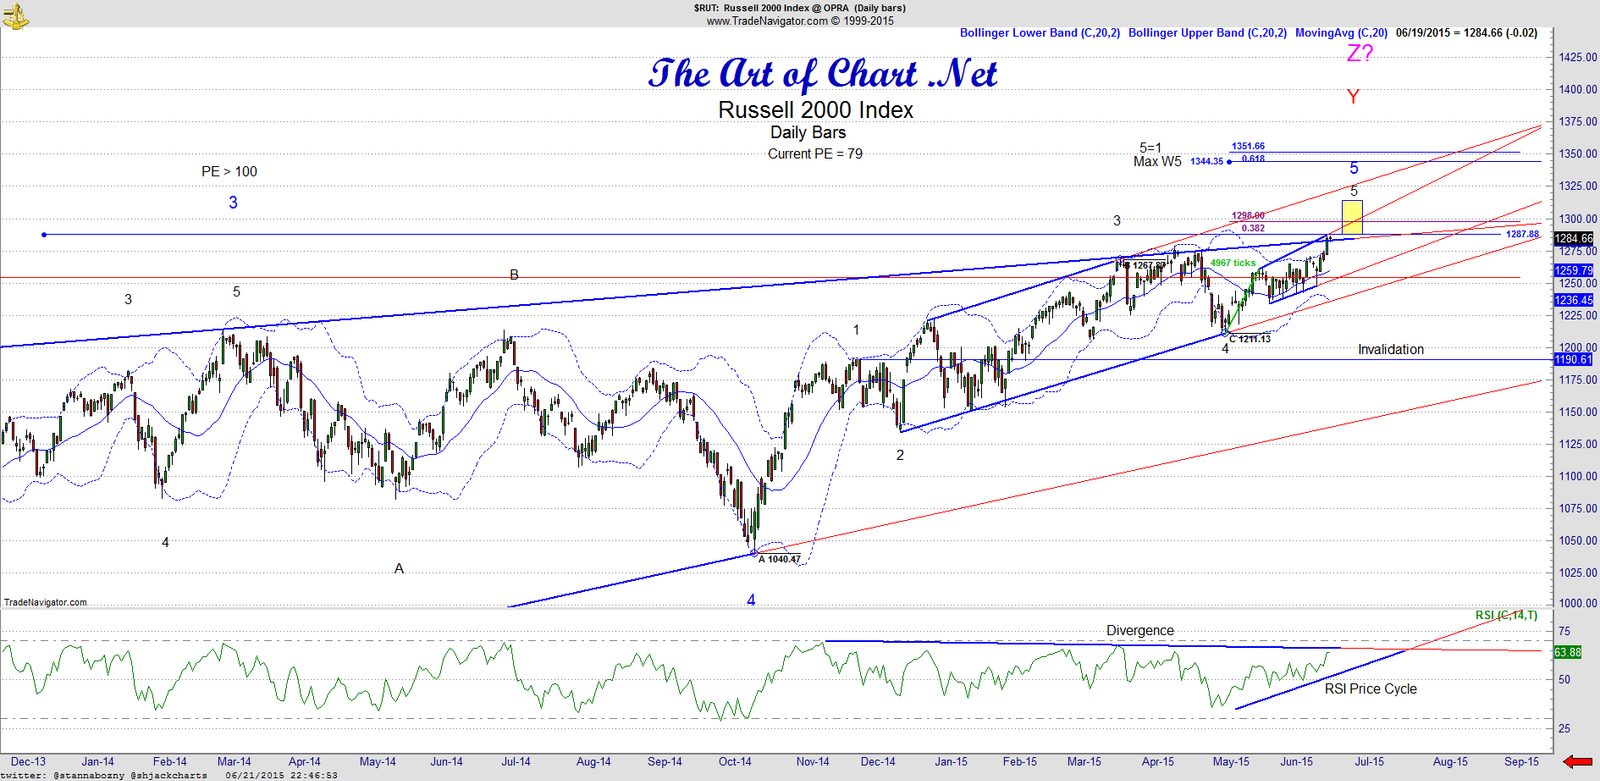
Russell 2000, Daily Chart – Layering in some detail:
1. So wave 3 in Feb of 2014, the PE ratio of the Russell was over 100 at the top of that wave. We won’t see that again anytime soon! Current PE is 79 -Â someone needs to let some of the air out of this balloon before it pops! : )
2. Note the 5=1 target mentioned above and the last wave up – currently at long term rising resistance trend line.
3. RSI price cycle is nearing completion and may be done. Divergence exists on a daily basis. What does this mean? Fewer and fewer issues are carrying this higher. We may see a pullback and a final push higher, we are close to the end of this impulse.
4. The upper Bollinger Band was punched Friday, we will break back below and when we do the short term retrace will start.
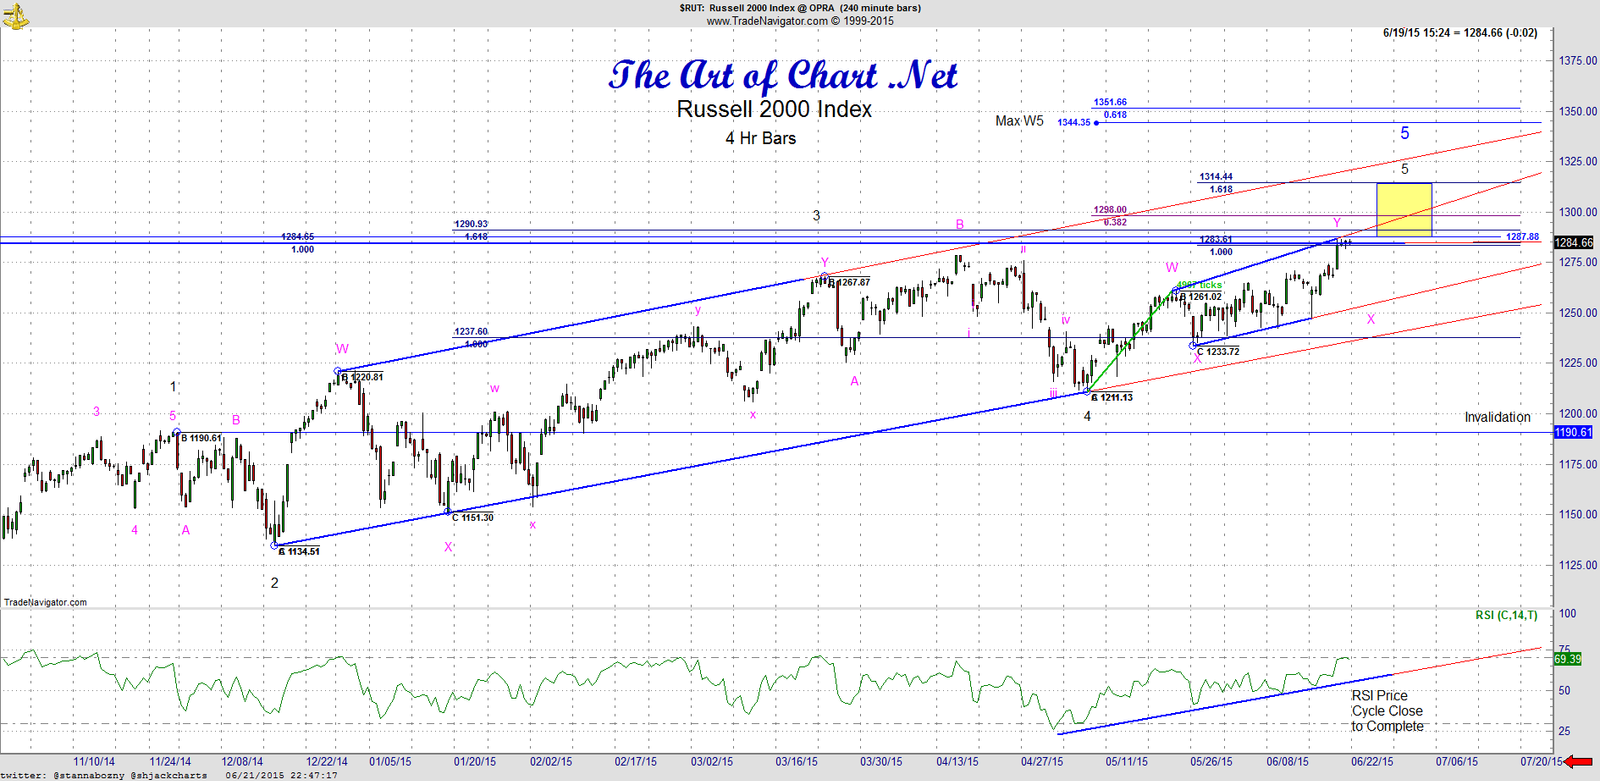
Russell 2000, 240 minute chart – A few more notes:
1. You can see the black 1-2-3-4 complete and we are working on finishing black 5. Likely from black 4 we have seen W-X-Y which is enough to complete this impulse OR we can still see X-Z. Watch for support short term at 1255 or so. We violate the rising support trend line from 1233 and we are done with this move to the upside.
2. Note the RSI Price Cycle close to complete here – ideally we see a small divergence as we put in X-Z to complete black 5. Ideally, we see the yellow box for wave Z and possibly as high as 1314. Nothing is ever ideal in trading. : )
3. Note Invalidation of the bullish structure is at 1190.61 and max structure extension  is 1345.35 for this impulse.
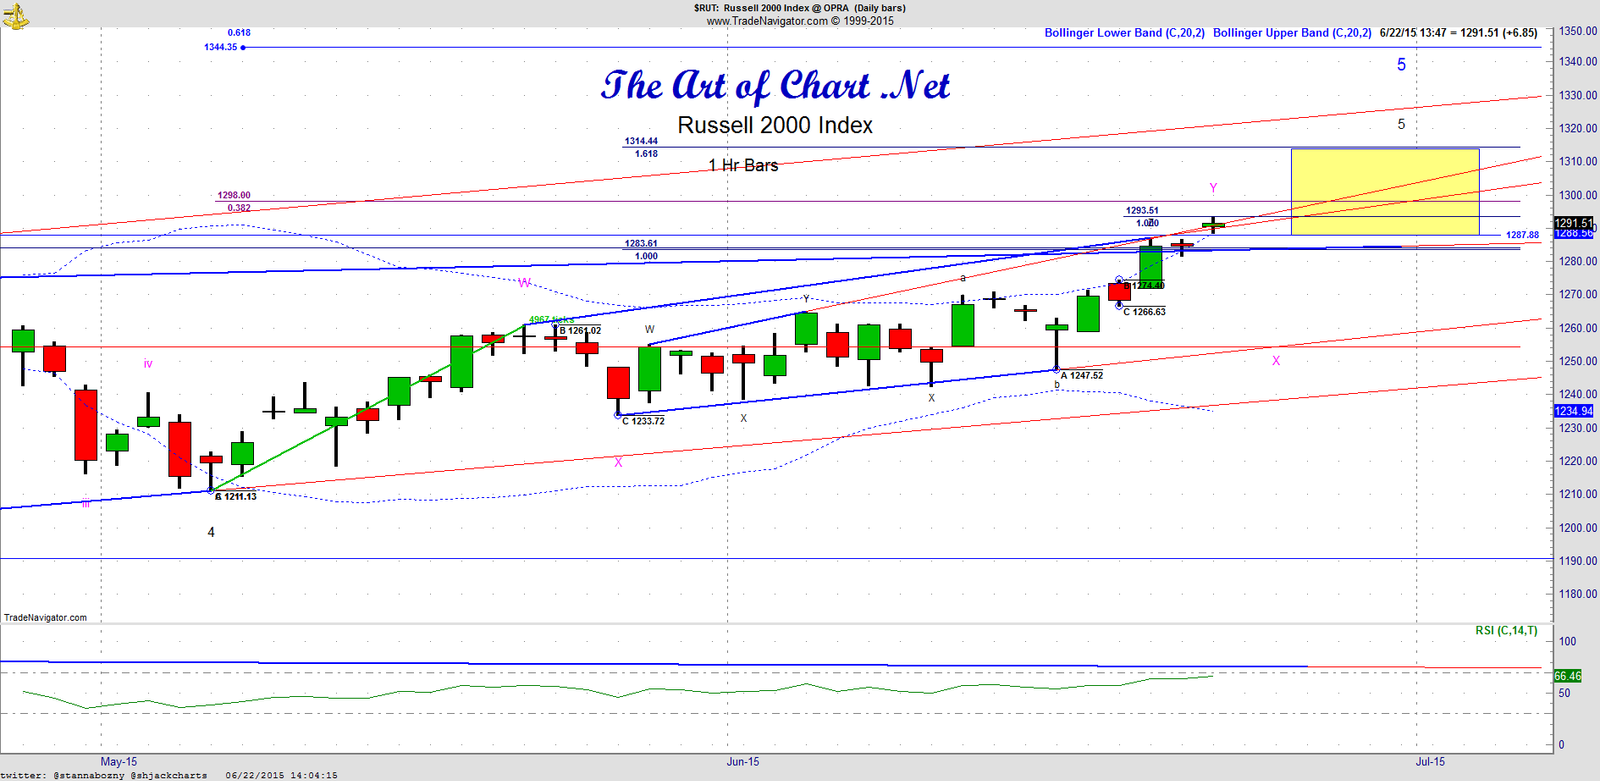
Russell 2000, 60 minute chart – more details:
1. The reason we may be done here is the expanding ending diagonal in small black – w-x-y-x-z complete at 1293.51. These usually are terminal moves – the back test to roughly the 1260 area or the rising support trend line will be the tell. Break both and we fall away to the test the invalidation level mentioned above. Hold that trend line and we put in Z/5 in the yellow box. Price will make these decisions this week imho.
2. So after we turn then what? 1211ish area roughly for the first legg down into mid July, rebound into September then a killer move lower into March 2016. Two possible target areas for March 2016 – 1135 or 1050. September likely a double top of some kind. Cycle Chart below for more detail.
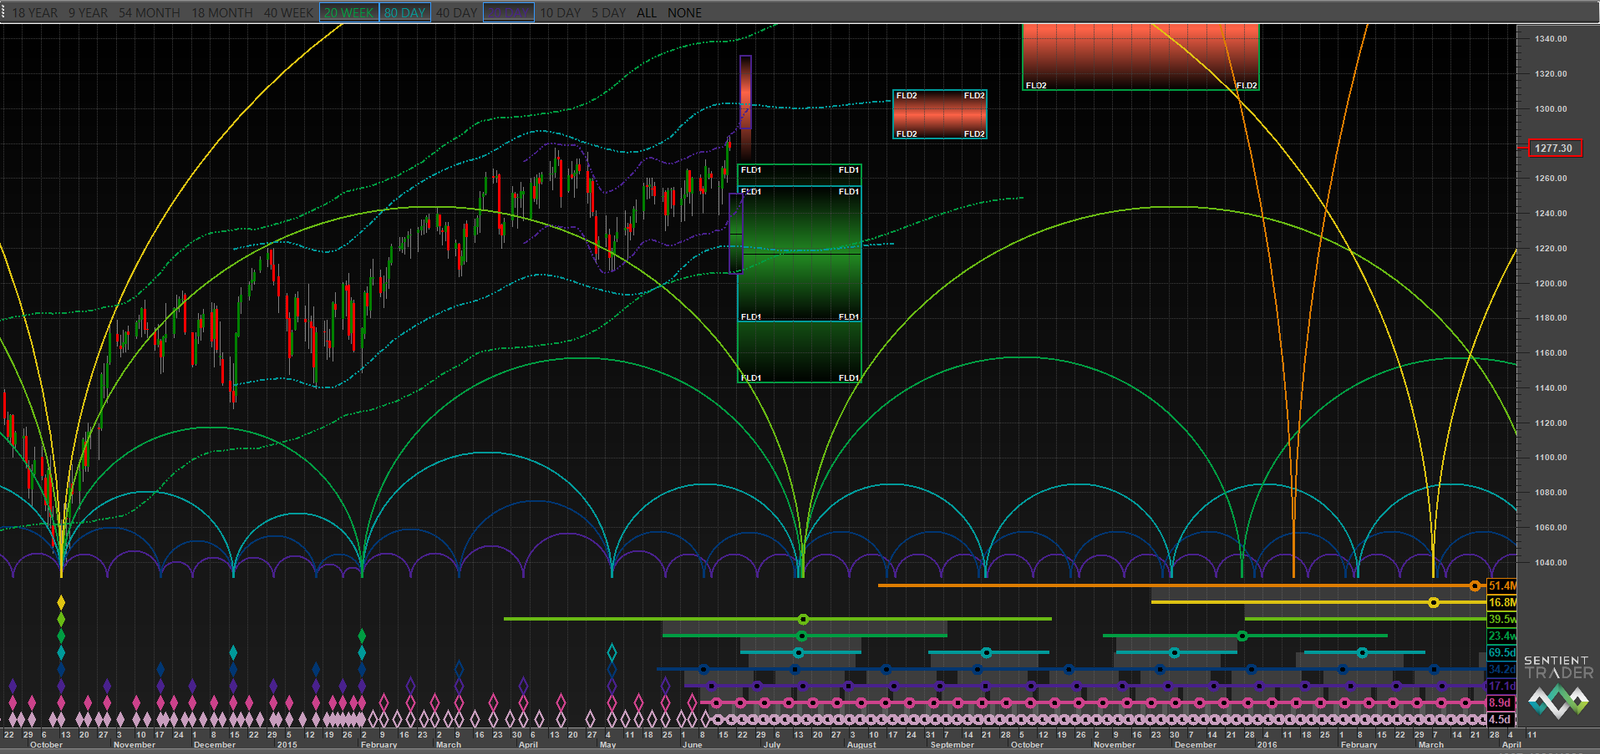
TF Daily Cycle Chart – Placing Price in Time:
1. Placing price in time is probably the most misunderstood and under utilized aspect of trading. Patterns only have so much time to play out and traders can improve their hit rate by understanding how time plays a role. There are various tools Jack and I use to place our trading in “time”, the cycle chart above is just one of them.  The above chart is a nice clear depiction of high and low windows which helps me focus on the most likely bullish and bearish scenarios. When price action, structure and time all line up – you have a great trade.
2. The chart above is showing a small high window this week but then look at July 17th – the cycles line up for a significant low. A cycle is nothing more than a cycle bracket aligning on multiple time frames. When you have seven time frames all lined up, like we do in mid-July, odds are pretty good that we will see a low in that timeframe. The 40 week cycle low center date is on July 17th along with other smaller cycles. The 18 month cycle low is in March of 2016. These are two windows to watch. I will update the cycle chart events over the coming months as we watch them unfold.
The Russell is just one of the indexes saying that a July low is looming. More on the Dow and the Nikkei later this week. : )
 22nd Jun 2015