Paragon Options is a service that focuses exclusively on futures options. By doing so we are taking advantage of superior premiums compared to stock options and asset diversification offered by futures. Paragon Options is a directional options service that will focus on Metals, Energies, Bonds, Currencies, and Commodities. This service will launch on June 25th.
A Long Oil Trade
In the short term, Oil Futures had been forming a likely bull flag for a couple of weeks, and was close to flag support, so we decided to start a long trade at 67.19, and add on a likely retest of the low. That retest never happened so the trade ended up only half the initially intended size. We were looking for a minimum break up into the 70/1 area, which we have since seen of course.
As long as Oil Futures (CL) closes at expiry over 70 the theta burn (time decay) is adding value every day, so for the moment we are leaving the trade on to maximise the profits. We are reviewing the position every day in case the outlook changes.
CL Jun 60min Chart 2nd May AM:

Oil Futures Trade Setup
We were looking for a rise in Oil futures (CL) from around the $67 to $70 in the next couple of weeks. This trade is live and current although we have obviously seen a big rise in the underlying since we opened the trade.
The CL June futures was trading $67.19 as we opened the position on the 2nd May and we had a risk invalidation level of $65.50.
May/Jun 70.00 put calendar vs short May 65.50 put
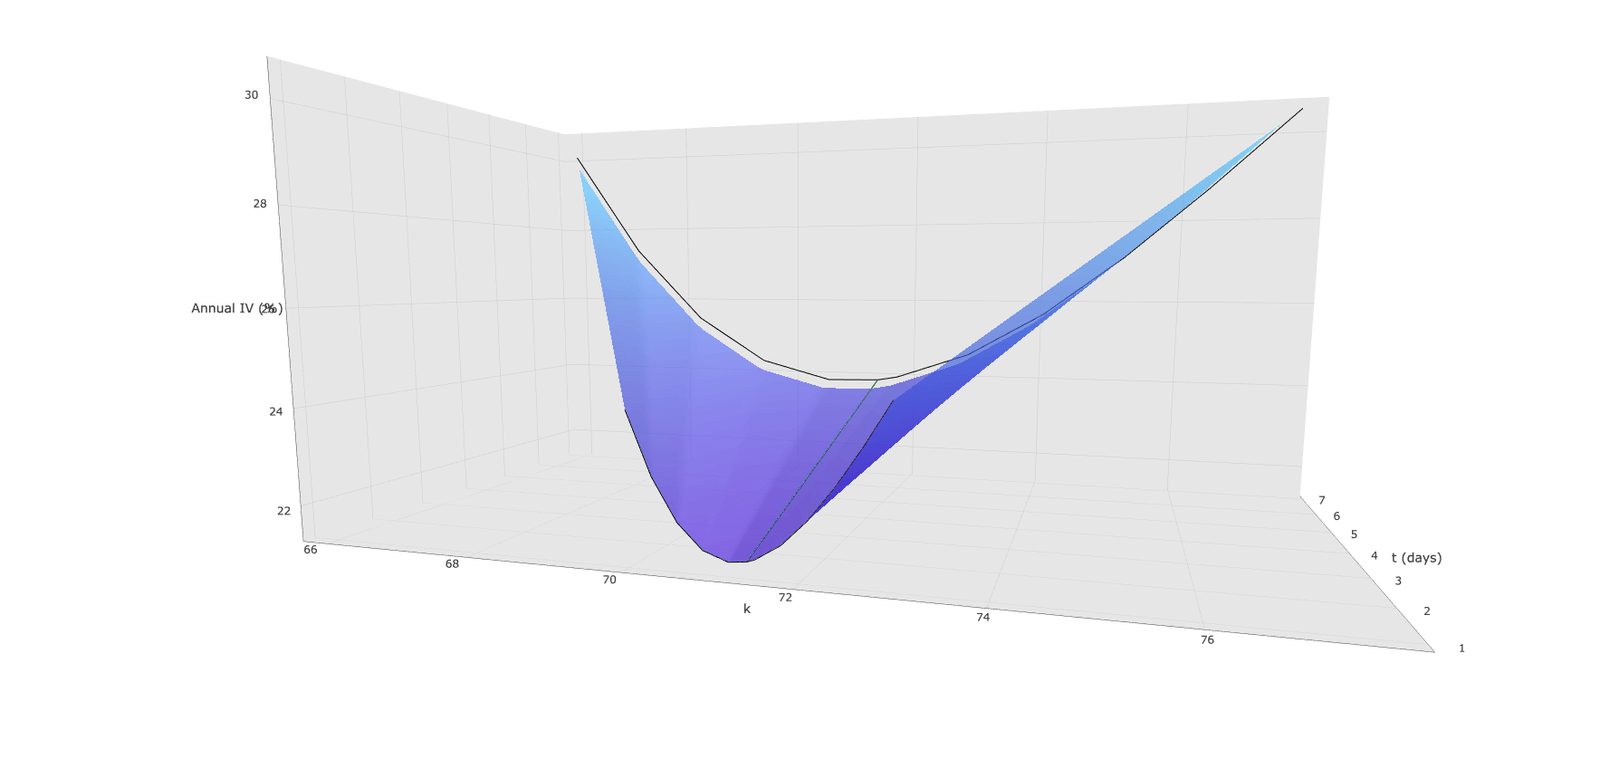
Once again this was a new and unique structure created especially for this trade. There is a very high implied volatility on CL and for this reason it is very attractive to sell futures options where possible to try to collect theta and any falls in volatility. Here is a plot of the June futures volatility surface. You will notice the extreme skew OTM in both calls and puts.
The Calendar on Oil Futures Options
We opted to sell the Oil Futures Options May 70.00 put as it was only 15 days until expiry and so the time premium on this option would burn up very quickly. Obviously this was a put option that was $3 in the money when we opened the position, therefore we wanted to hedge it with the same put option only in June, so we purchased a June 70.00 against it.
The idea here is that should Oil Futures (CL) rise to around the 70.00 mark within the 15 day time frame, the short put would drop out worthless and we would be left with a long ATM put which we could either then sell or hold and wait for a short reversal. A calendar spread like this is a straight time decay (theta) play although it is also affected by Gamma and Vega which I won’t go into here although these factors were naturally considered when constructing the strategy. The fact that the position was set up in the money gave us the directional bias that we were looking for and so carried a small positive delta of 10.
The Short Put
As we were more bullish on Oil Futures (CL) than the 10 delta reflected, another leg was added to the strategy.
We opted to sell a put at our risk invalidation level of 65.50 also in the May series as this was $1.50 out of the money and was collecting a lot of time decay (theta) as well as also being subject to any incoming vol crush, the short May 70.00 put would also lose value from any vol drop.
With this added leg, we were now collecting a lot of theta and were short vega in the front month. The overall delta of the position had increased to 39 from 10 which closer reflected our bullish stance and it was set up for a cost of $0.15 ($150 per 1 lot traded).
Summary
Unfortunately I can not show P&L diagram of this position as it is cross month and can not be plotted for that reason.
However, I can provide you with an update on this position. At the time of writing CL is trading at Jun 71.59 and the position has increased in value to a colossal $1.08 from the set up cost of $0.15 a gain of 620% and so is a superstar trade.
It should be noted that yesterday 9th May we decided to close out the short 65.50 put as it had decreased in value from $810 to $40 and there is no upside in leaving a short put open to make a maximum of $40 so this was simply good risk management, something that is the primary consideration of any trade that we take.
Update – Gold trade
Since we opened this position on the 26th of April we have seen Gold rise slightly from 1324 to 1321 (August futures).
As covered in the previous post detailing this trade which you can see here , we thought that Gold might dip slightly and so the position was constructed in such a way that on a small dip, we would make money. This is indeed now the case as the position has increased in value since inception from $-1.30 ($130 credit per 1 lot traded) to $0.8 ($80 positive) meaning we have made a small profit of $210 per 1 lot traded. We still have the same view on Gold that we expect it to trade higher over the coming months, until it starts to move we are happy to keep collecting time decay (theta). Overall the position is working very nicely and we will keep you updated with its progress.
 10th May 2018
Gentlemen, I trade options every day and love to see additional takes on some of the trade ideas from the Daily Update and such. One suggestion: in order to make this service something I might think about subscribing to, can you please actually put the position clearly in the post? For instance, did you buy or sell the calendar in /CL? I assume sell given the bullishness, but perhaps not. Also, what was the price for each position? These seem like basic requirements for anyone trying to judge if these types of trades would make sense in one’s portfolio, plus give a way to track them outside of seeing a post with an update. Thanks for the great content, it’s always appreciated.
That’s exactly what I was looking for. Thanks and good trade!
Hi Joshua,
Matt here. Our apologies, this was in the post but got lost as we transferred it from Word to our web publisher. It has been corrected now and you will see three extra paragraphs explaining the missing info.
In short answer to your question the calendar spread was long. The price for each leg of the position I don’t log as I just set it up as a net. Unfortunately on this occasion I can’t remember the prices although i do remember that the short 65.50 put was sold for a credit of 81c.
In future if you would find it helpful I can post the price of each leg as well as the net.
Kind regards,
Matt